# @esri/cedar 中文文档
规范地址:https://npmcn.com/package/%40esri/cedar/
版本:1\.1\.1
npm 元数据更新时间:2025-10-31T20:20:50.852Z
中文译文更新时间:2026-11-13T22:50:51.312Z
软件包许可:Apache-2\.0
本文由上游 README 翻译,可能存在偏差,请结合原文核对 API、命令与配置。版权与许可归原作者所有。
原始 npm 页面:https://www.npmjs.com/package/%40esri/cedar
原文对照:https://npmcn.com/package/%40esri/cedar/?lang=original
项目主页:https://github.com/esri/cedar#readme
源码仓库:https://github.com/esri/cedar
## 关键信息(来自 npm 元数据)
- 包体积(解压后):385 kB,39 个文件
- 模块格式:ESM + CJS
- TypeScript 类型:包内自带
- 运行依赖:1 个
- peer 依赖:@esri/arcgis-rest-types ^2\.0\.0,@esri/arcgis-rest-request ^2\.0\.0,@esri/arcgis-rest-feature-layer ^2\.0\.0
- 首次发布:2017-10-18T18:25:04.450Z
- 最新版本发布:2021-01-13T22:10:11.371Z
- 近 30 天下载量:6531(2026-10-14 至 2026-11-12,npm 官方下载统计)
- 已发布版本数:23(近 12 个月 0 个)
## 中文简介
ArcGIS 平台可视化框架
## 安装
```sh
npm install @esri/cedar
```
也可以使用:`pnpm add @esri/cedar`、`yarn add @esri/cedar`、`bun add @esri/cedar`
## README
# @esri/雪松
[](https://travis-ci.org/Esri/cedar)
## ArcGIS 的 JavaScript 图表
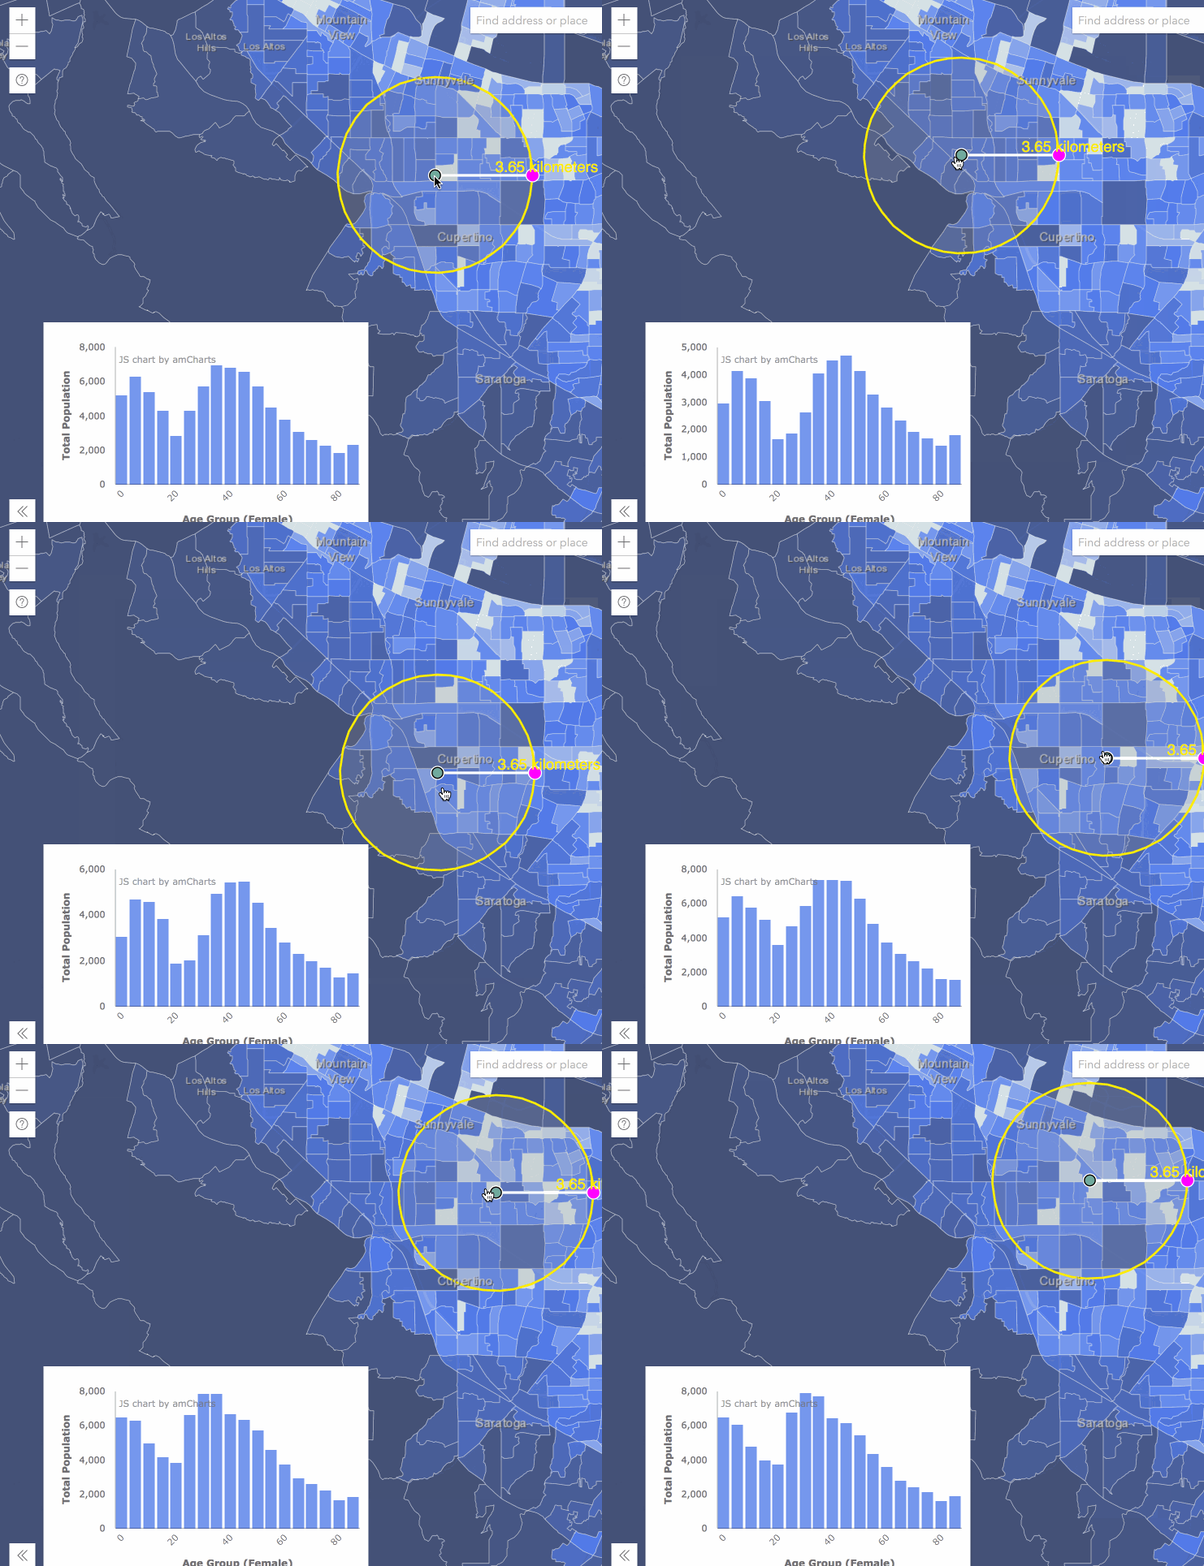
Cedar是一个用于设计和共享数据可视化的库:
- 由来自ArcGIS的数据提供动力 [地图,场景,](https://developers.arcgis.com/javascript/) 财务报告和审定财务报表 [服务](https://developers.arcgis.com/documentation/core-concepts/rest-api/)
- 包括智能默认可视化选择
- 满足特定需求
见下文如何 [开始](https://npmcn.com/package/%40esri/cedar/#readme-getting-started),理解雪松饼 [核心概念](https://npmcn.com/package/%40esri/cedar/#readme-concepts),或见 [演示](https://npmcn.com/package/%40esri/cedar/#readme-demos) 雪松在行动.
您正在查看雪松花v1.x的文档。 你也可以看到 [雪松v.x的文档](https://github.com/Esri/cedar/tree/v0.x)。 。 。 .
## 开始
### 正在安装 Cedar
**注:** 如果您想在 Ember.js 应用程序中使用雪松,请参见 [木质- cli- 雪松](https://github.com/Esri/ember-cli-cedar) 换句话说.
你可以安装雪松及其 [依赖关系](https://npmcn.com/package/%40esri/cedar/#readme-dependencies) 以 npm 为单位 :
```bash
npm install --save @esri/arcgis-rest-feature-layer@^2.0.0 @esri/arcgis-rest-request@^2.0.0 amcharts3 @esri/cedar
```
线条 :
```bash
yarn add @esri/arcgis-rest-feature-layer@^2.0.0 @esri/arcgis-rest-request@^2.0.0 amcharts3 @esri/cedar
```
或者,你可以从 [unpkg.com (英语)](https://unpkg.com/) CDN 作为 [如下所示](https://npmcn.com/package/%40esri/cedar/#readme-from-a-cdn)。 。 。 .
### 正在导入 Cedar
如果你在现代的网络应用中 使用锡达的话 [网络软件包](https://webpack.js.org/),你可以加载 Cedar 及其 [依赖关系](https://npmcn.com/package/%40esri/cedar/#readme-dependencies) 使用 `import` 发言.
```js
// import the amCharts base library
import "amcharts3/amcharts/amcharts";
// in this case, we only need bar charts, so we'll import the appropriate amCharts module
import "amcharts3/amcharts/serial";
// optionally import an amcharts theme; cedar provides a calcite theme
import "@esri/cedar/dist/umd/themes/amCharts/calcite.js";
// import the cedar Chart class
import { Chart } from "@esri/cedar"
```
如果您需要使用其他图表类型, 或者想要使用安图插件, 请导入相应的安图模块 _导入雪松之前_数字 :
```js
// for pie charts
import "amcharts3/amcharts/pie";
// for scatter and bubble charts
import "amcharts3/amcharts/xy";
// for radar charts
import "amcharts3/amcharts/radar";
```
见 [图表文档](https://github.com/amcharts/amcharts3) 用于获取关于导入安图模块的更多信息.
### 使用锡达
一旦加载到雪松,您可以在指定的元素中创建并显示图表。 首先创建元素 :
```html
```
然后添加一个将配置雪松并渲染图表的脚本:
```js
// connect to the data
var datasets = [{
"url": "https://services.arcgis.com/uDTUpUPbk8X8mXwl/arcgis/rest/services/Public_Schools_in_Onondaga_County/FeatureServer/0",
"name": "schools",
"query": {
"orderByFields": "Number_of_SUM DESC",
"groupByFieldsForStatistics": "Type",
"outStatistics": [{
"statisticType": "sum",
"onStatisticField": "Number_of",
"outStatisticFieldName": "Number_of_SUM"
}]
}
}];
// designate a one or more series to show the data on the chart
var series = [{
"category": {"field": "Type", "label": "Type"},
"value": {"field": "Number_of_SUM", "label": "Number of Students"},
"source": "schools"
}];
// optionally override any of the cart type's default styles
var overrides = {
"categoryAxis": {
"labelRotation": -45
}
}
//create a cedar chart using the known 'bar' type
var elementId = 'chart';
// NOTE: the following line assumes you've imported Chart like:
// import { Chart } from "@esri/cedar";
// if you've loaded the Cedar using script tags
// and are using the cedar global instead
// you should replace this line with:
// var chart = new cedar.Chart(elementId, {"type": "bar"})
var chart = new Chart(elementId, {"type": "bar"})
.datasets(datasets)
.series(series)
.overrides(overrides);
// render the chart
chart.show();
```
见 [API 文档](https://esri.github.io/cedar/api) 关于如何使用雪松图的进一步详情.
见 [演示文稿](https://npmcn.com/package/%40esri/cedar/#readme-demos) cedar与其他库合作的例子,例如用于JavaScript或React的ArcGIS API.
### 配置 Cedar
您可以配置雪松以使用自定义执行 `fetch()` 设置 `cedar.config.fetch = myCustomFetch`。 。 。 .
## 概念
### 雪松图的组成部分
平面图由 [定义](https://esri.github.io/cedar/api/interfaces/idefinition.html),包括:
- 数组 [数据集](https://esri.github.io/cedar/api/interfaces/idataset.html),每个有 _无论是_数字 :
- (单位:千美元) `url` 到ArcGIS 特征层,并附带可选 [查询参数](https://developers.arcgis.com/rest/services-reference/query-feature-service-layer-.htm)
- _或者说_ 内入 `data`,这可以是 [特性集](https://esri.github.io/arcgis-rest-js/api/common-types/IFeatureSet/),或数组 [特性](https://esri.github.io/arcgis-rest-js/api/common-types/IFeature/) 或者说 [战俘](http://blog.dreasgrech.com/2012/02/creating-pojos-in-javascript.html)编号
- 数组 [系列](https://esri.github.io/cedar/api/interfaces/iseries.html) 将数据绑入图表上的地块(栏、行、点等)
- 财务报告和审定财务报表 `overrides` 对图表类型默认样式的具体修改
### 图表类型
锡达目前提供一套常用图表类型,包括: [栏](https://esri.github.io/cedar/?type=bar), (中文(简体) ), [线条](https://esri.github.io/cedar/?type=line), (中文(简体) ), [区域](https://esri.github.io/cedar/?type=area), (中文(简体) ), [散开](https://esri.github.io/cedar/?type=scatter), (中文(简体) ), [发泡](https://esri.github.io/cedar/?type=bubble), (中文(简体) ), [馅饼](https://esri.github.io/cedar/?type=pie),以及 [雷达](https://esri.github.io/cedar/?type=radar)。在未来,开发者将有可能创建自定义图表类型,供拥有自己数据源的其他开发者使用.
### 发言
#### 地图外的图表和自定义可视化
[2018 Dev 首脑会议幻灯片](https://tomwayson.github.io/Charts-and-Custom-Visualizations-Beyond-the-Map/)
[2017 Dev首脑会议的视频](https://www.youtube.com/watch?v=V4T1y53yaj8)
## 演示文稿
见 [此代码笔](https://codepen.io/tomwayson/pen/paxgeO) 尝试创建类似上面的简单条形图.
那你们可以了 [查看并修改不同类型图表的定义](https://esri.github.io/cedar/)。 。 。 .
你可以看到如何使用雪松与 [用于 JavaScript 的 ArcGIS API](https://developers.arcgis.com/javascript/) 在这些例子中:
- [汇总地图数据的图表](https://codepen.io/tomwayson/pen/YaKGjZ)
- [使用图层特性作为内置数据的图表](https://codepen.io/tomwayson/pen/mxdVqO)
- [使用 cedar w/ 客户端侧图层查看查询](https://jsbin.com/juqafec/edit?html,output)
见 [此代码对话框](https://codesandbox.io/s/esri-cedar-in-react-forked-kyoc2?file=/src/App.js) 以例说明如何在反应中使用Cedar.
### 正在装入 Cedar
改为 [安装](https://npmcn.com/package/%40esri/cedar/installing-cedar) 财务报告和审定财务报表 [导入](https://npmcn.com/package/%40esri/cedar/importing-cedar) 锡达,你可以装上锡达和它 [依赖关系](https://npmcn.com/package/%40esri/cedar/#readme-dependencies) 包括指向 CDN(或本地安装的这些库版本)的脚本标记。 这会使 `cedar` 您的应用程序可访问全球.
#### 从CDN
```html
```
如果您需要使用其他图表类型, 或者想要使用安图插件, 请在装入雪松之前加载相应的安图脚本 :
```html
```
## 依赖关系
锡达还不是另一个JavaScript图表库. 相反地,雪松是一个非常薄的包装器,围绕其他进行举重的图书馆. 锡达用途 [图表](https://www.amcharts.com/javascript-charts/) 库作为其绘图引擎。 锡达也使用 [@esri/arcgis-resst-fetature-layer (中文(简体) )](https://esri.github.io/arcgis-rest-js/api/feature-layer/) 财务报告和审定财务报表 [@esri/arcgis-rest-请求](https://esri.github.io/arcgis-rest-js/api/request/) 以查询特性数据。 你将需要 [安装](https://npmcn.com/package/%40esri/cedar/#readme-installing-cedar) 这些图书馆以及您的应用程序中的雪松。 如果你正在从CDN装入雪松,请参考 [装入雪松](https://npmcn.com/package/%40esri/cedar/#readme-loading-cedar) 上节 `