@bycelium/evidences-diagrams
Combine evidence, measure dissonance, and explore how prior beliefs change the result.
Open the live demo · Download the standalone demo
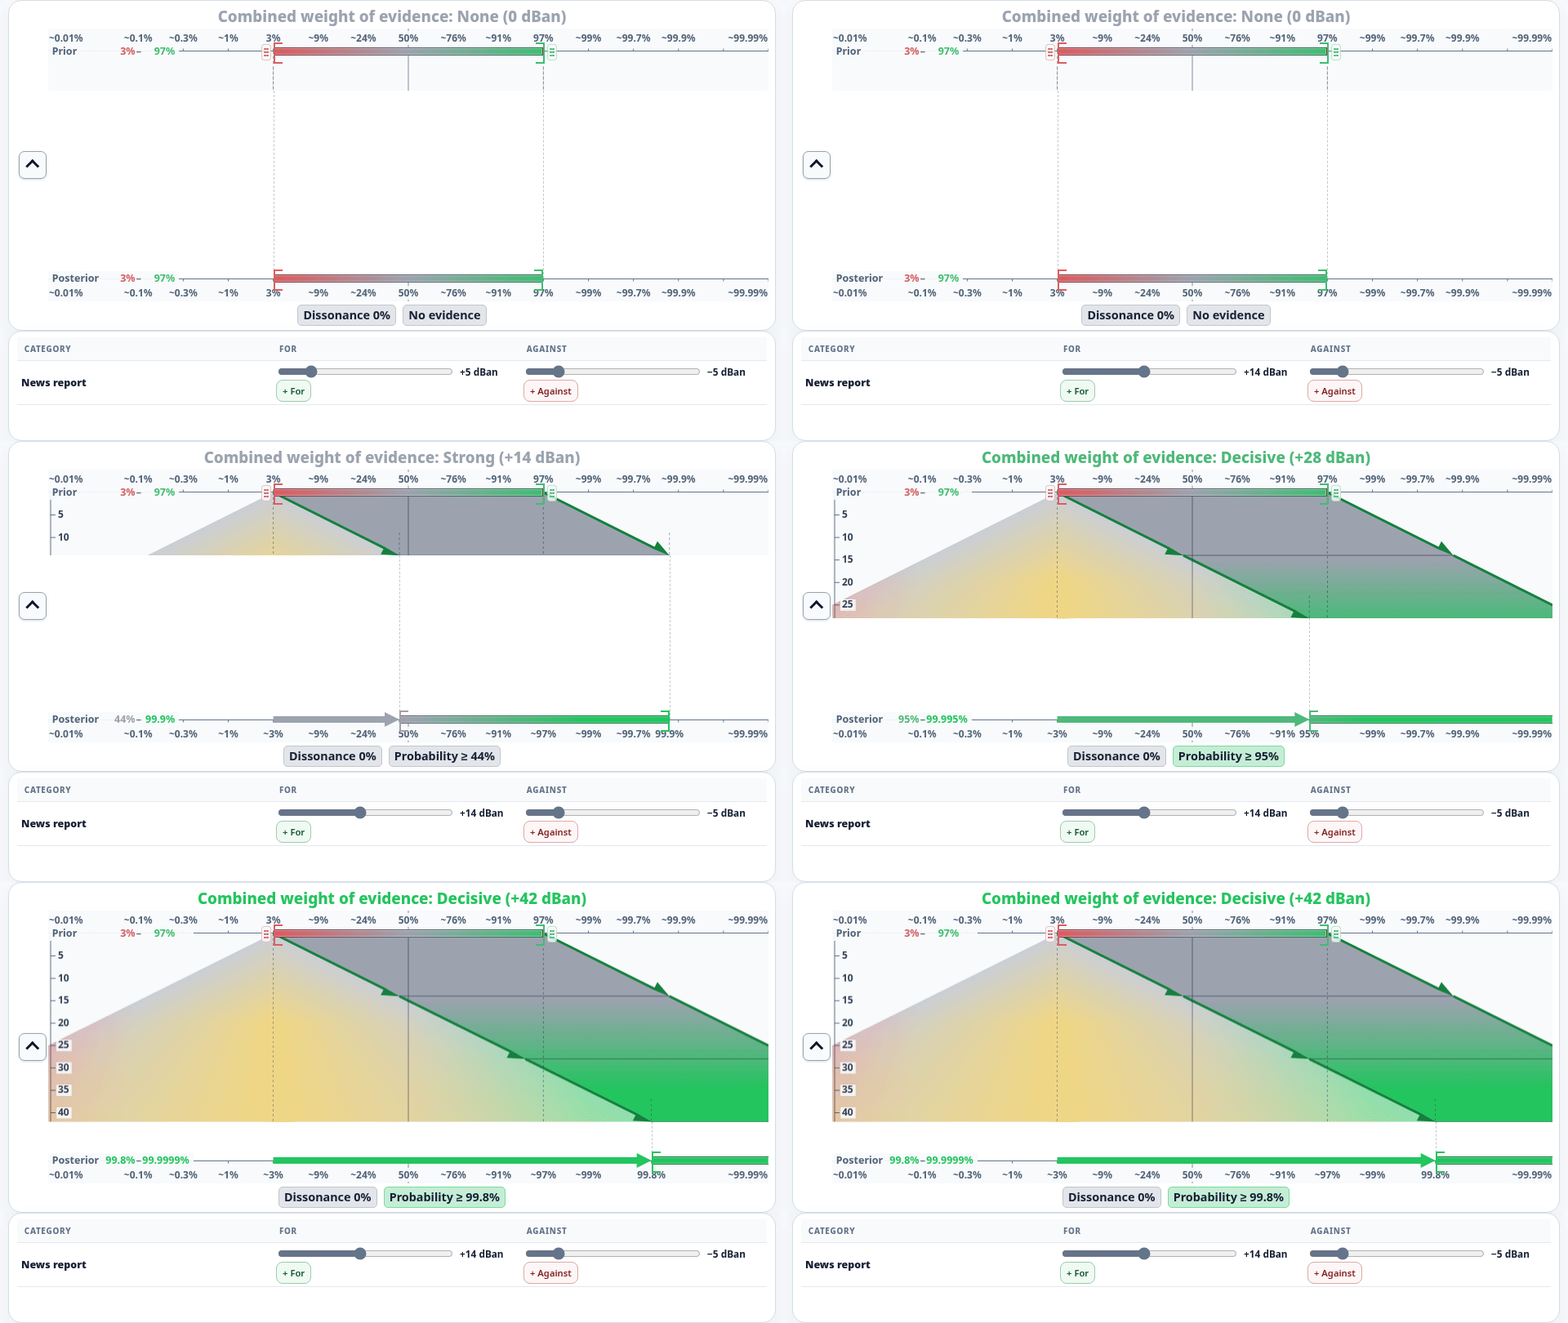
Add evidence
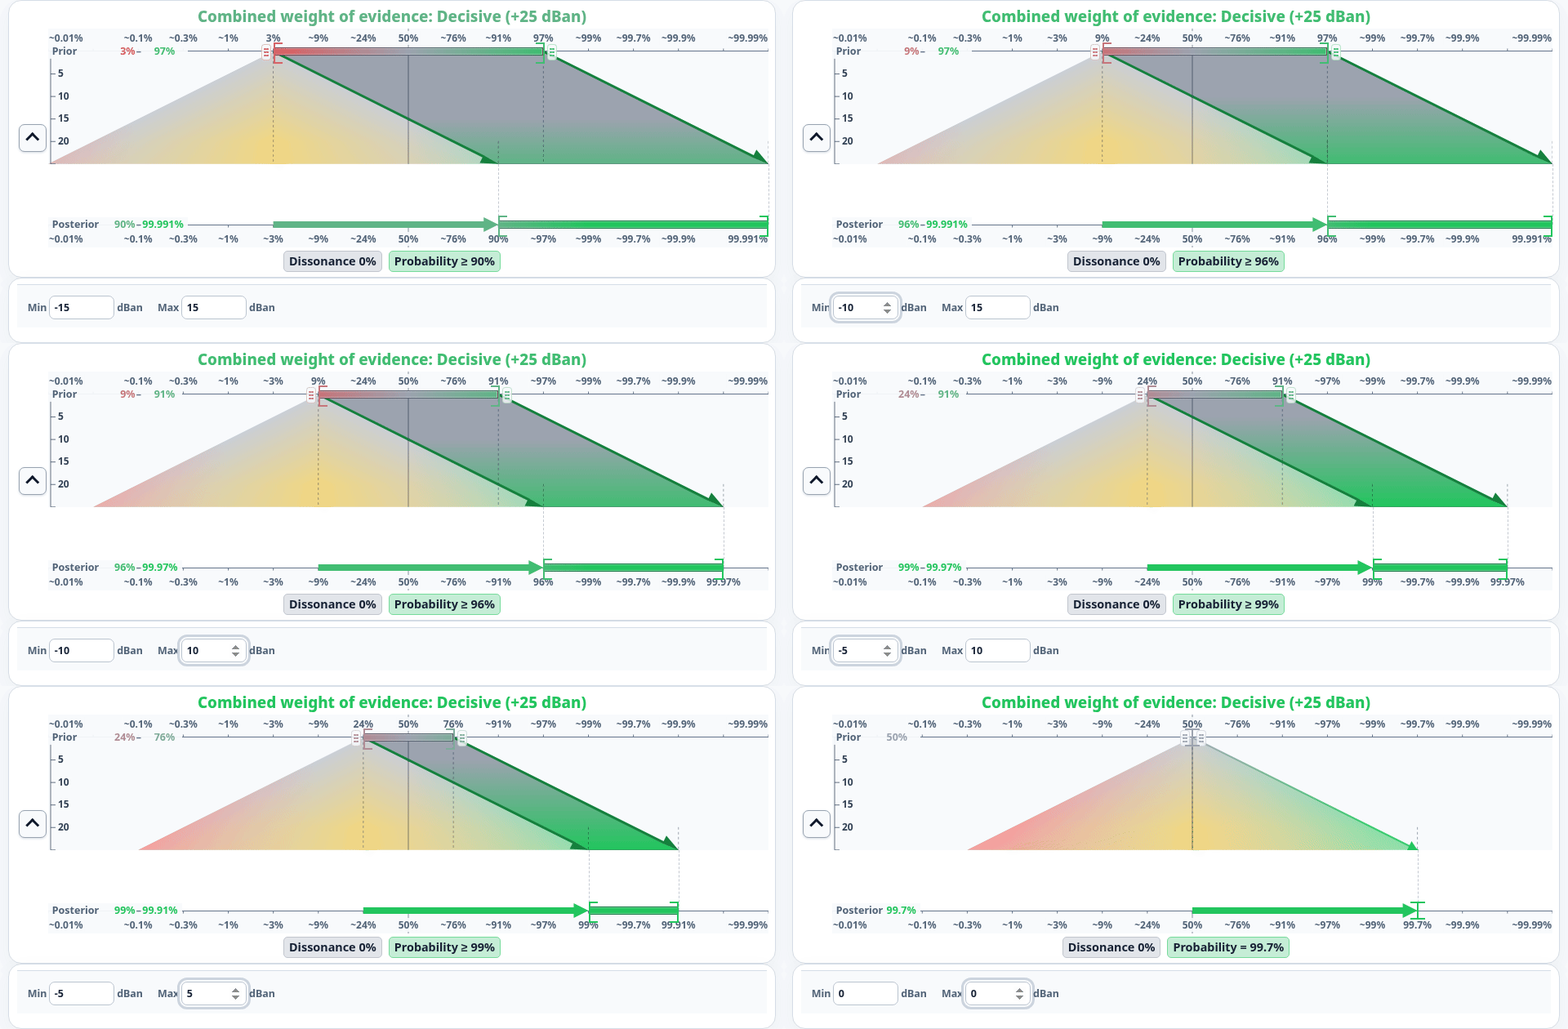
Change the prior
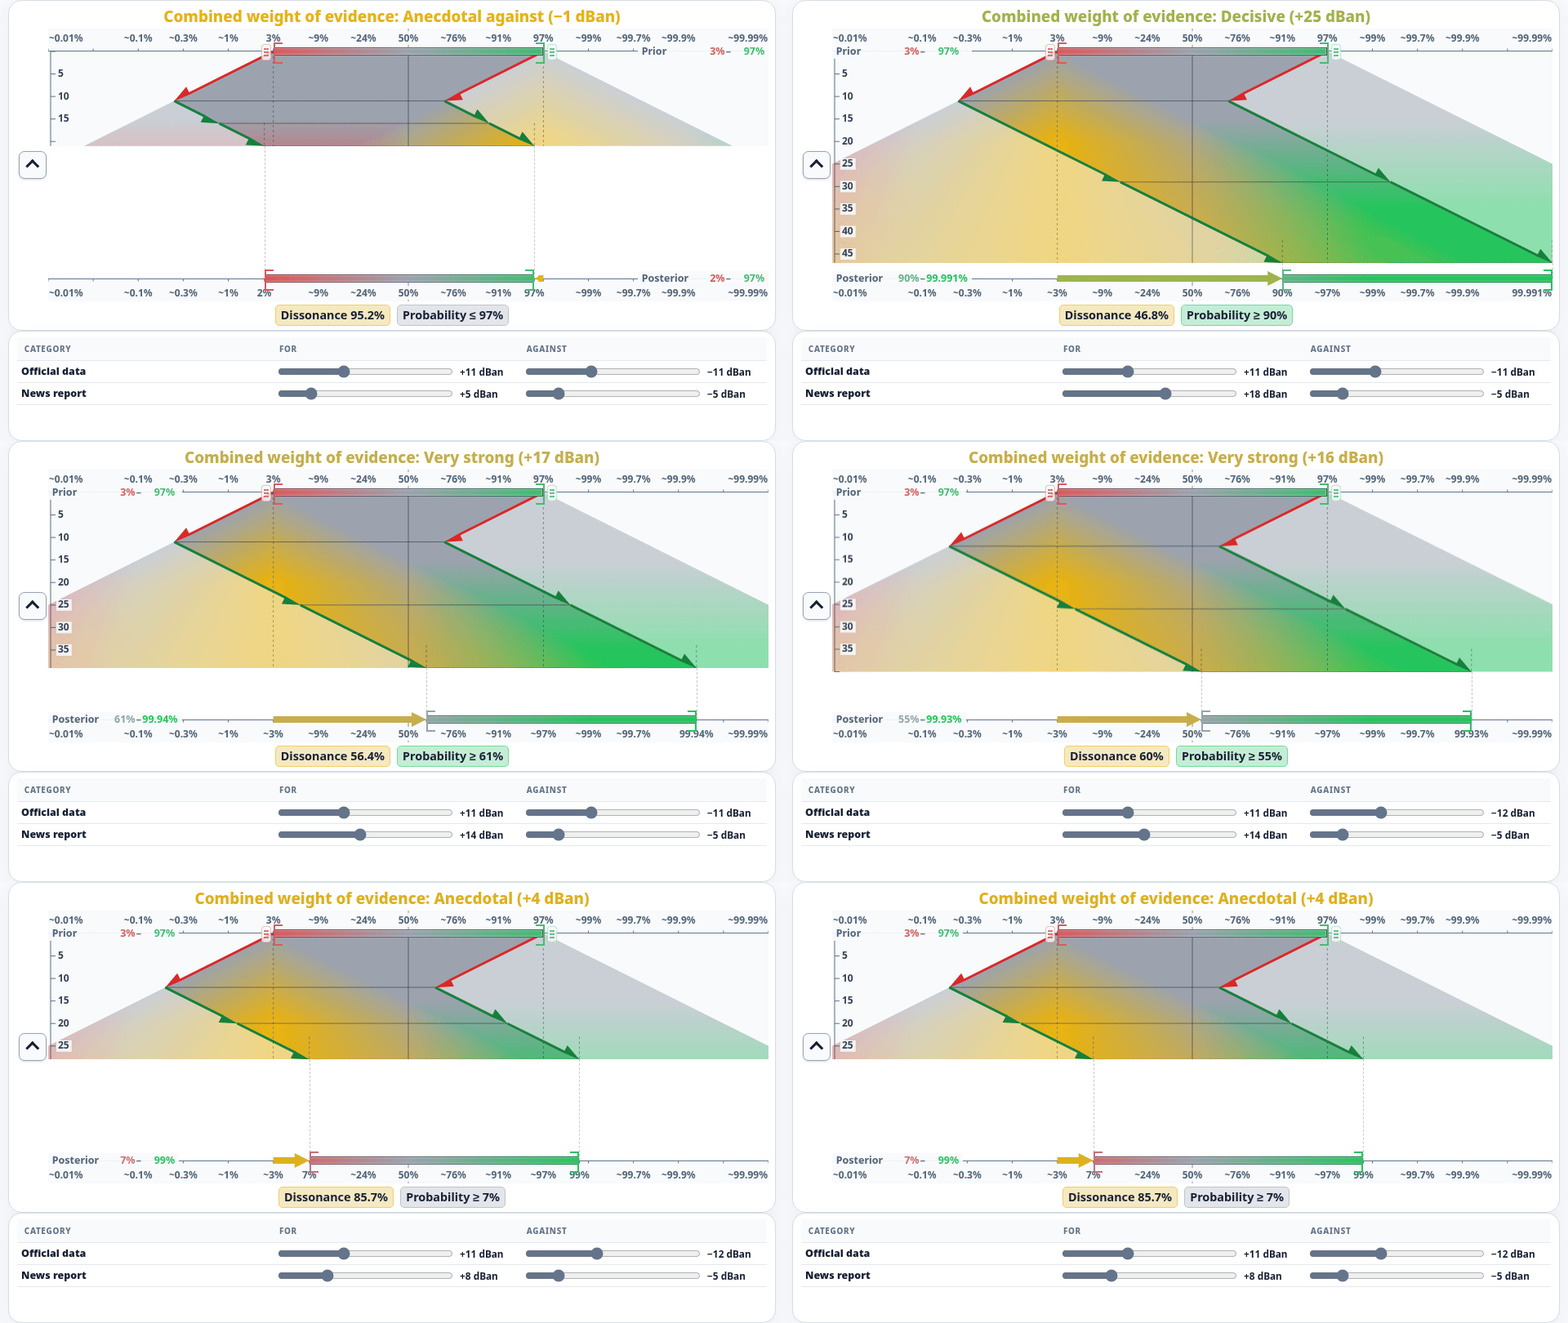
Adjust evidence weights
The demo supports English and French, with editable categories and illustrative weights. The downloaded HTML works offline.
Demo walkthrough
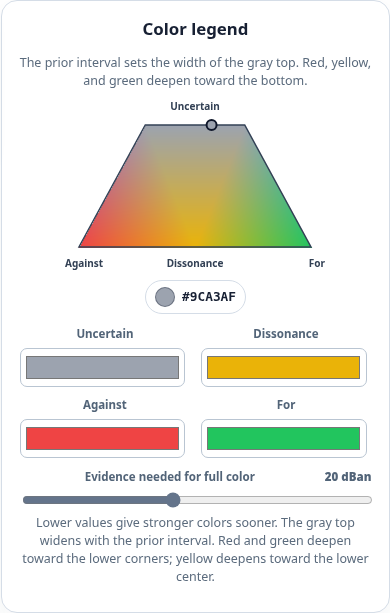
No evidence and the color legend
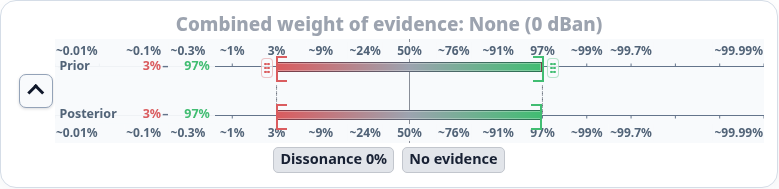
With no evidence, the result is none (0 dBan). The prior band is visible and
the probability remains indeterminate. The color legend places dissonance at the
top, evidence against at the left, evidence for at the right, and no evidence at
the center.
Adding and combining evidence
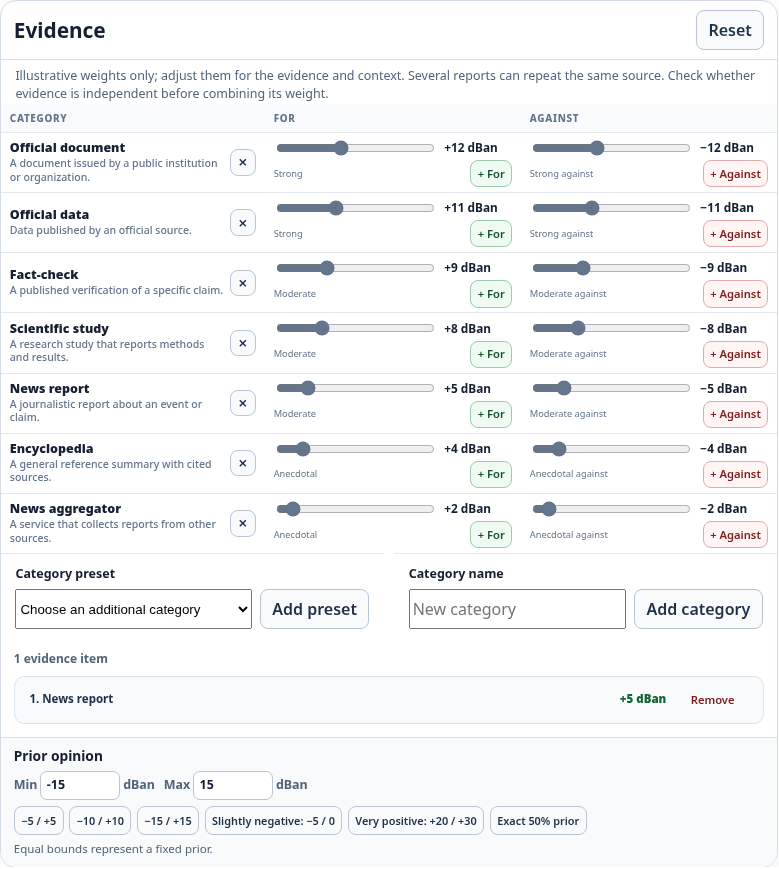
Choose a category, set its supporting or opposing weight, and add it to the history. Editing a category control updates its existing evidence entries of the same category and direction. The history supports selection and removal.

Weak evidence can remain gray when the posterior interval crosses 50%.
| Evidence for | Evidence against |
|---|---|
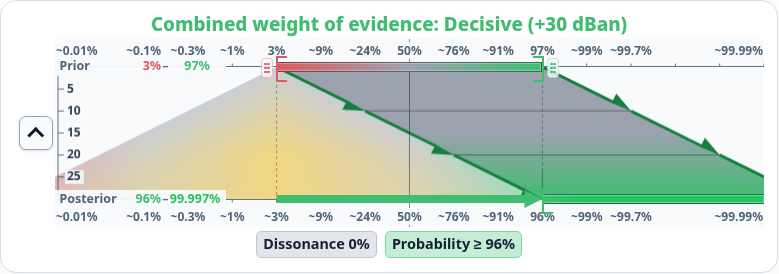 | 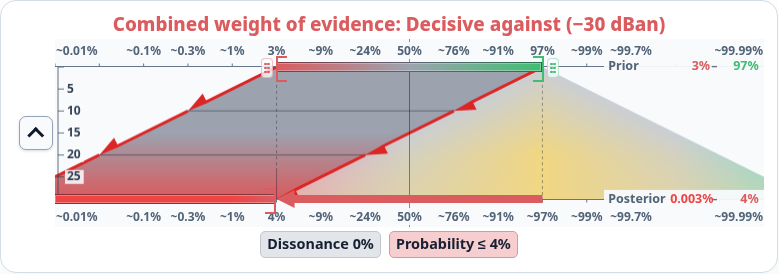 |
+10 +10 +10 = +30 dBan | −10 −10 −10 = −30 dBan |
These walkthrough examples use adjusted weights. The resultant starts at the conservative prior endpoint and ends at the posterior odds used for the displayed probability.
Conflicting evidence and prior bounds
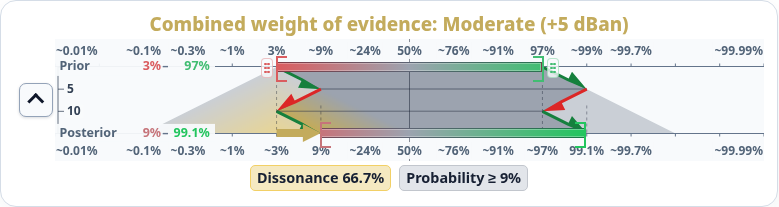
The ribbon retains the cumulative path, so opposing evidence remains visible.
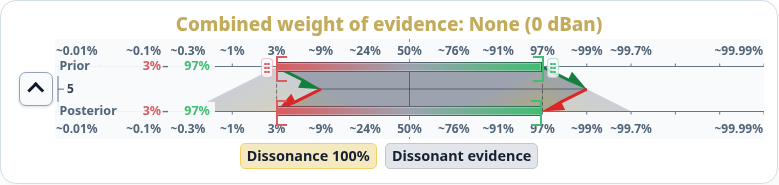
Yellow identifies dissonance: equal and opposing weights cancel in the net weight while remaining in the absolute weight.
| Prior interval | Exact prior |
|---|---|
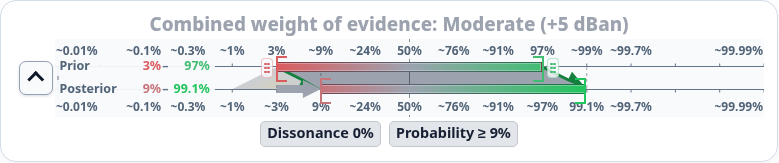 | 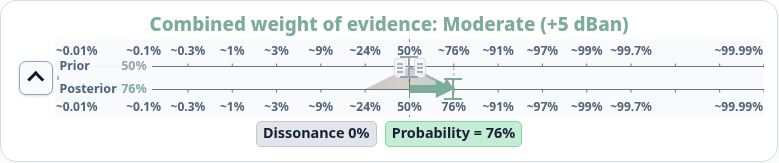 |
Move the prior handles or use the keyboard to change each bound. Equal bounds form an exact prior and expose one reusable handle.
Model
For independent signed evidence weights wᵢ, the package calculates:
S = Σ wᵢ, the net weight.A = Σ |wᵢ|, the absolute weight.D = 1 − |S| / A, the dissonance, withD = 0whenA = 0.
For example, +9 dBan and −1 dBan produce S = +8 dBan, A = 10 dBan,
and D = 20%. Decibans are log odds: +10 dBan multiplies the odds by ten.
For probability p:
d = 10 × log10(p / (1 − p))
p = 1 / (1 + 10^(−d / 10))
A prior interval [min, max] is expressed in decibans. Net evidence translates
it to [min + S, max + S], then each endpoint is converted to probability. The
conservative probability uses the lower endpoint for positive evidence and the
upper endpoint for negative evidence. Equal bounds produce an exact probability.
Install
pnpm add @bycelium/evidences-diagrams
API reference
import {
  aggregateEvidence,
  buildEvidenceDiagram,
  boundProbability,
} from '@bycelium/evidences-diagrams';

const evidence = [
  { id: 'report', weightDecibans: 12 },
  { id: 'counter-analysis', weightDecibans: -5 },
];

const summary = aggregateEvidence(evidence);
summary.netWeightDecibans; // 7
summary.absoluteWeightDecibans; // 17
summary.dissonance; // 10 / 17

const diagram = buildEvidenceDiagram(evidence);
diagram.steps[1].end; // { netWeightDecibans: 7, absoluteWeightDecibans: 17 }
diagram.resultant.jeffreysBand; // 'moderate'
diagram.probability.text; // 'Probability ≥ 13 %'

boundProbability(summary).direction; // 'lower'
| Export | Purpose |
|---|---|
aggregateEvidence(weights) | Returns net weight, absolute weight, and dissonance. |
probabilityToDecibans({ probability }) | Converts probability to decibans. |
decibansToProbability({ weightDecibans }) | Converts decibans to probability. |
boundProbability(summary, options?) | Returns a conservative, exact, or indeterminate probability. |
buildEvidenceDiagram(evidence, options?) | Returns a render-independent diagram model. |
jeffreysBand({ weightDecibans }) | Returns none, anecdotal, moderate, strong, very strong, or decisive; negative nonzero bands end with against. |
color, triangleColor, trianglePosition | Provide diagram color and triangular-legend values. |
DEFAULT_COLOR_OPTIONS | Provides default color settings. |
EvidenceWeight has weightDecibans. EvidenceSummary has
netWeightDecibans, absoluteWeightDecibans, and dissonance. Probability
has probability. ProbabilityBoundsOptions accepts minPriorDecibans and
maxPriorDecibans. ColorOptions adds saturationThresholdDecibans and
anchors.gray, anchors.yellow, anchors.green, and anchors.red.
Numeric ProbabilityBound values have direction (lower, upper, or
exact), probability, displayPercentage, and English text. An
indeterminate value has direction: 'indeterminate', a reason of
'no-evidence' or 'dissonant-evidence', and English text.
The default prior interval is [-15, +15] dBan. The diagram keeps raw decibans
in its steps and resultant so a consumer can choose its own projection.
Development and localization
pnpm install
pnpm build:demo
pnpm check
build:demo bundles the demo into demo/index.html; check runs the project
checks and consumer installation test. To add a locale, create a dictionary in
demo/locales/ and register it in demo/i18n.js. To add a category, update
demo/category-state.js and each locale dictionary.