CanvasJS Vue 图表插件 - 官方
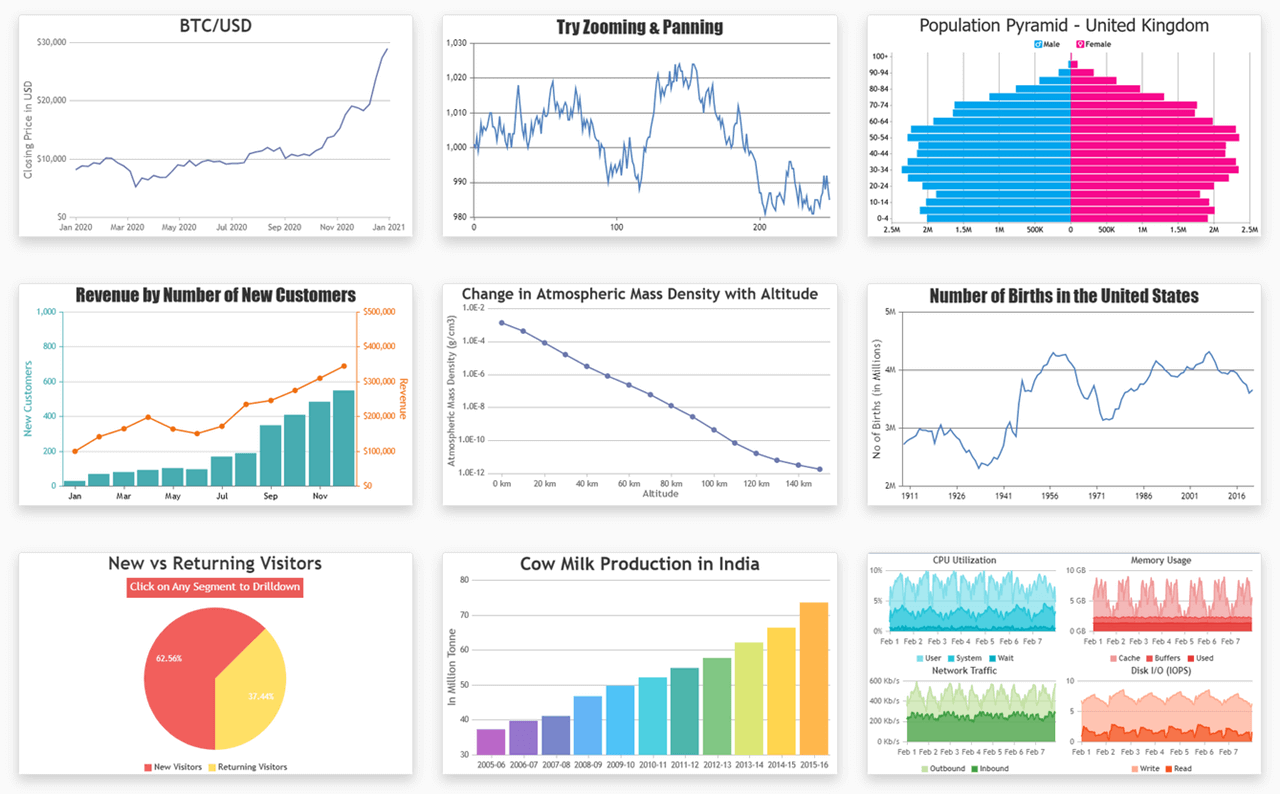
彩相画 Vue 图表 为您的 Vue.js 应用程序创建交互图表的插件。 图书馆支持多种图表类型,包括栏、行、区域、派、甜甜圈、烛台等。 并被捆绑有交互,动画,缩放/平板,导出为图像等特征.
重要链接
安装 CanvasJS Vue 图表
通过国家预防机制将 CanvasJS Vue Charts 软件包安装到您的 Vue 应用程序中.
通过国家预防机制安装 Vue 图表
npm install @canvasjs/vue-charts
见 npm 文档 更了解npm的用法.
导入 Vue 图表插件安装( S)
将 Vue 图表插件导入您的 Vue.js 应用程序并安装它 .
import { createApp } from 'vue'
import App from './App.vue'

import CanvasJSChart from '@canvasjs/vue-charts';

const app = createApp(App);
app.use(CanvasJSChart); // install the CanvasJS Vuejs Chart Plugin
app.mount('#app');
设置图表选项创建图表( C)
在 app.vue 中设置图表选项并使用“ CanvasJSChart” 选择器在模板标签内创建图表 .
<!-- App.vue -->
<script>
export default {
  data() {
    return {
      chart: null,
      options: {
        animationEnabled: true,
        title:{
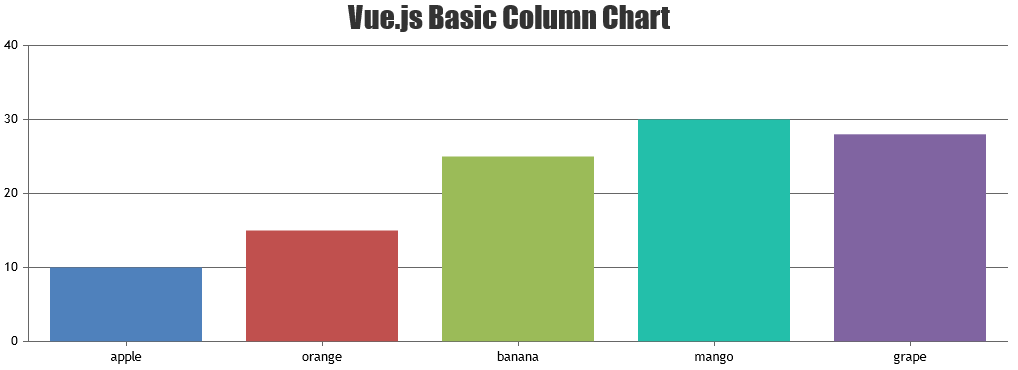
          text: "Vue.js Basic Column Chart"
        },
        data: [{
          type: "column",
          dataPoints: [
            { label: "apple",  y: 10 },
            { label: "orange", y: 15 },
            { label: "banana", y: 25 },
            { label: "mango",  y: 30 },
            { label: "grape",  y: 28 }
          ]
        }]
      }
    }
  }
}
</script>
<template>
    <CanvasJSChart :options="options"/>
</template>
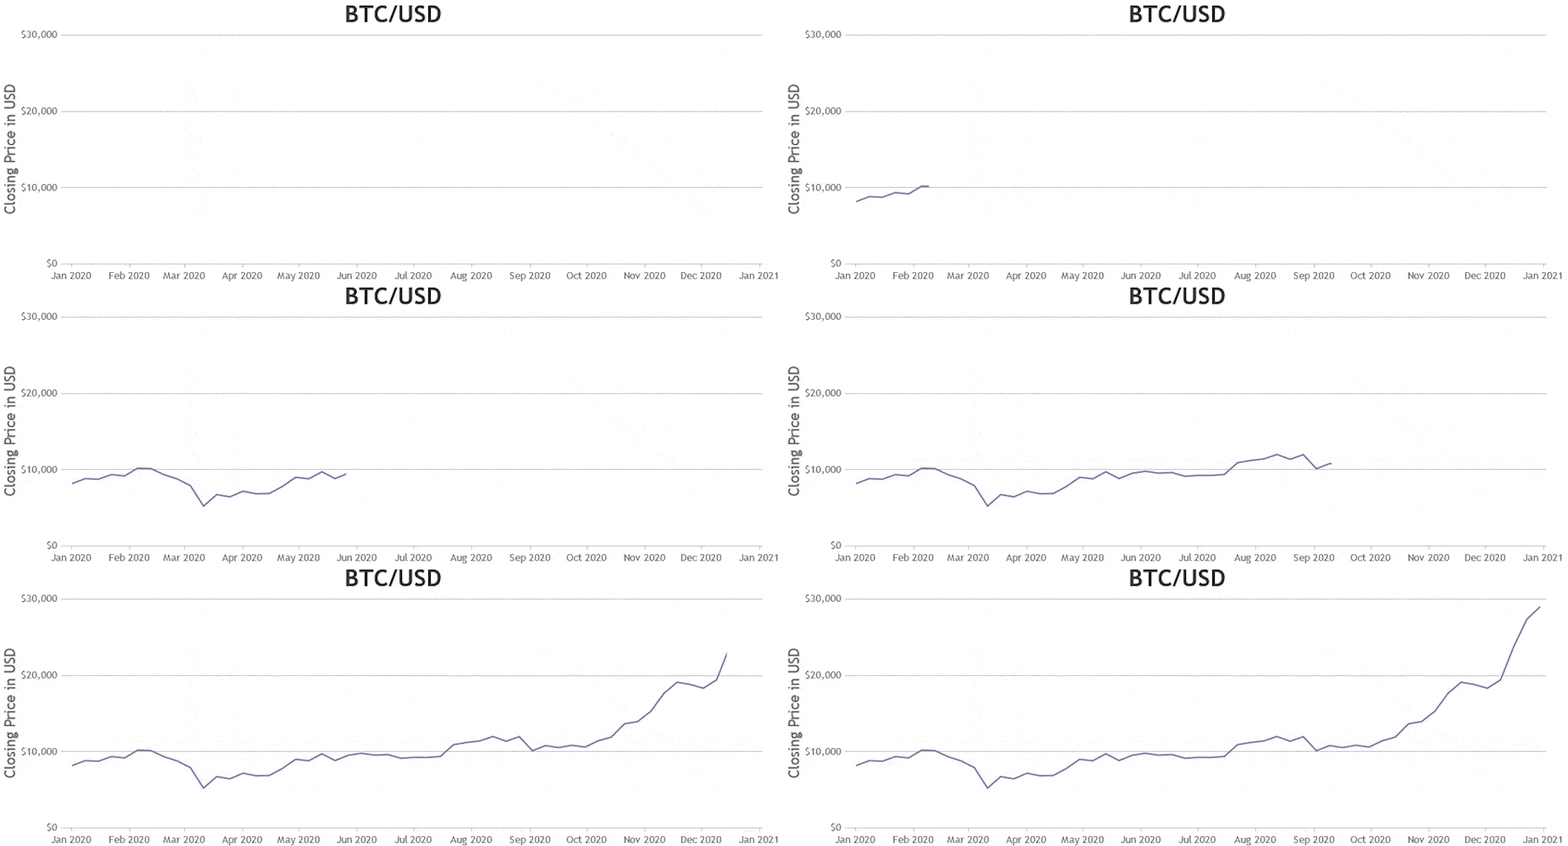
有动画的 Vue 图表
带有多 Y 轴的 Vue 图表
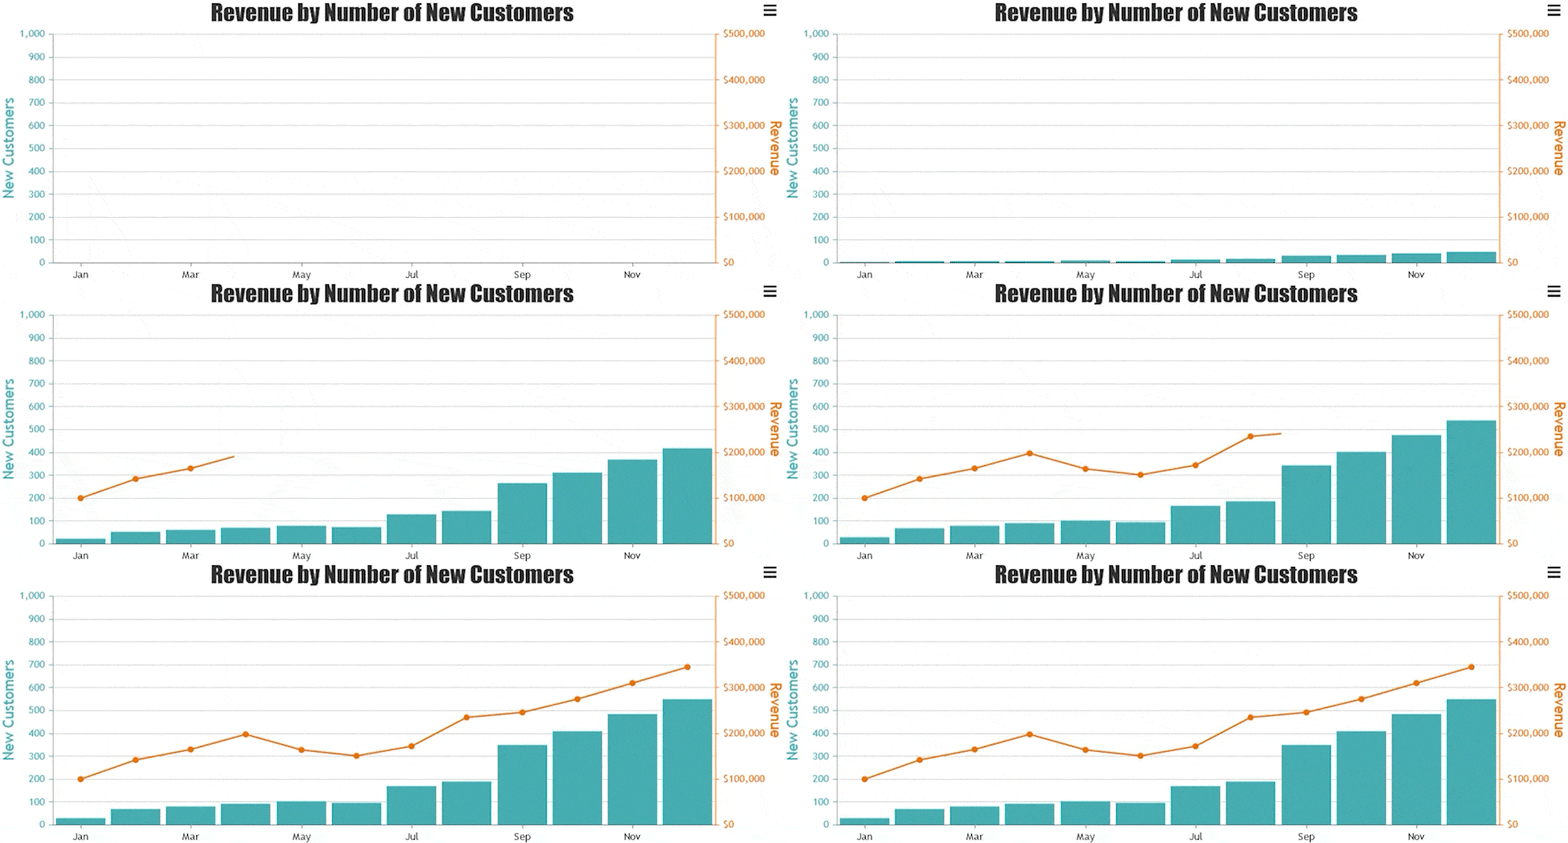
交互式 Vue 图表
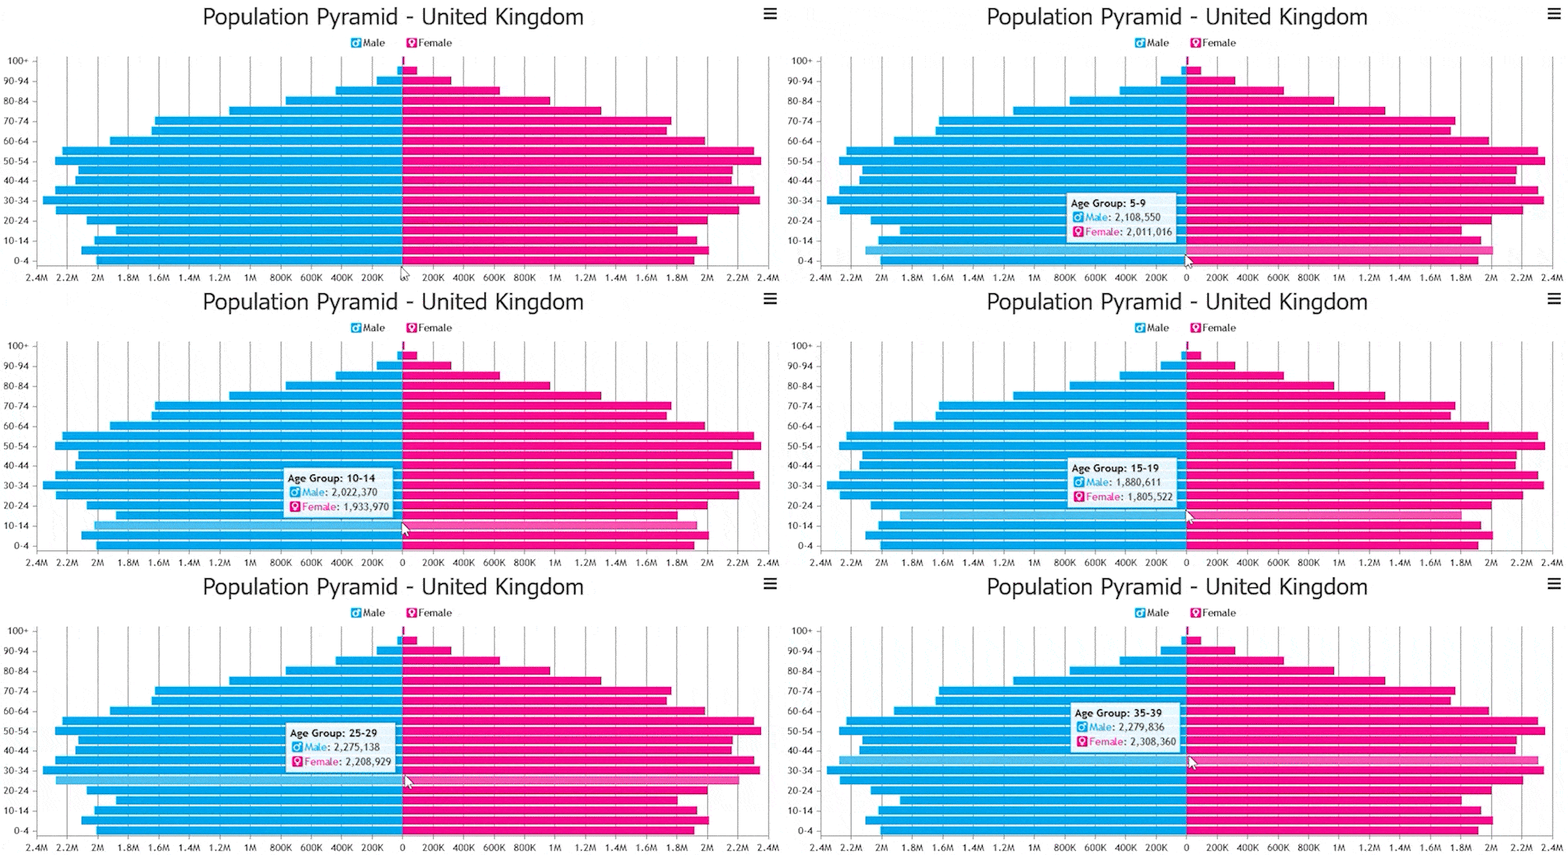
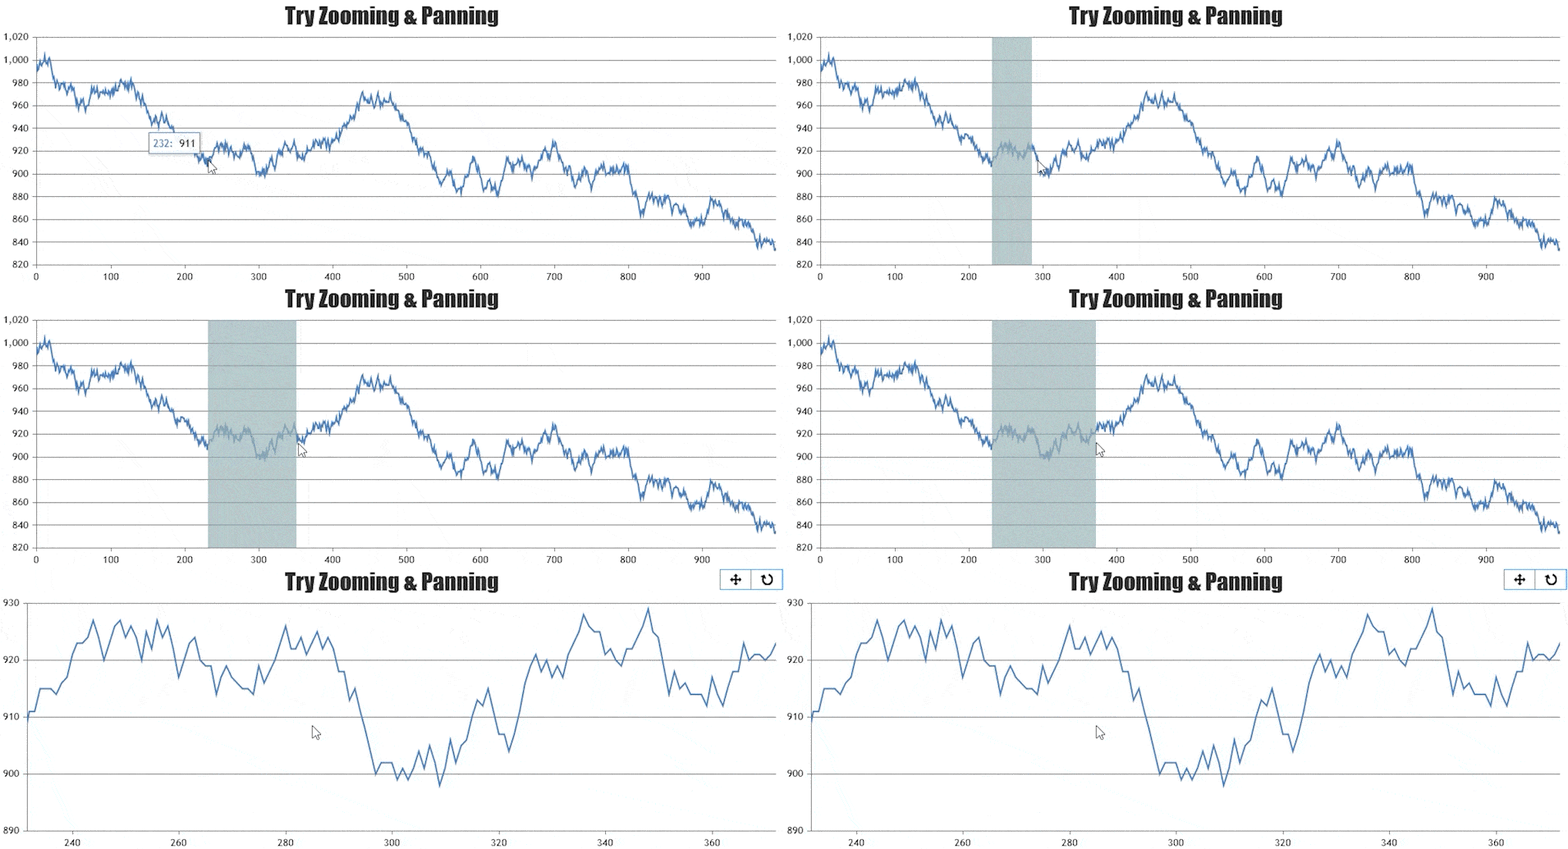
带有缩放/平面的 Vue 图表