


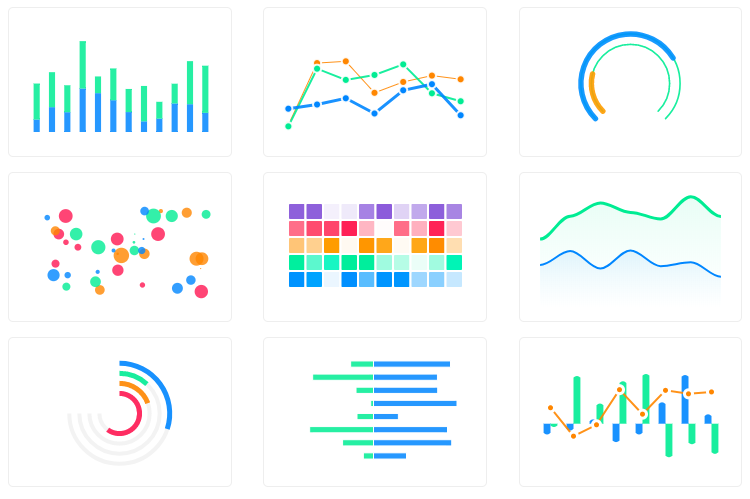
A modern JavaScript charting library that allows you to build interactive data visualizations with simple API and 100+ ready-to-use samples. Packed with the features that you expect, ApexCharts includes over a dozen chart types that deliver beautiful, responsive visualizations in your apps and dashboards. ApexCharts is an MIT-licensed open-source project that can be used in commercial and non-commercial projects.
Browsers support
 Firefox |  Chrome |  Safari |  Edge |  IE11 |
|---|---|---|---|---|
| 31+ ✔ | 35+ ✔ | 6+ ✔ | Edge ✔ | (IE11) ✔ |
Download and Installation
Installing via npm
npm install apexcharts --save
Direct <script> include
<script src="https://cdn.jsdelivr.net/npm/apexcharts"></script>
Wrappers for Vue/React/Angular/Stencil
Integrate easily with 3rd party frameworks
Unofficial Wrappers
Useful links to wrappers other than the popular frameworks mentioned above
- apexcharter - Htmlwidget for ApexCharts
- apexcharts.rb - Ruby wrapper for ApexCharts
- larapex-charts - Laravel wrapper for ApexCharts
- blazor-apexcharts - Blazor wrapper for ApexCharts demo
- svelte-apexcharts - Svelte wrapper for ApexCharts
Usage
import ApexCharts from 'apexcharts'
To create a basic bar chart with minimal configuration, write as follows:
var options = {
  chart: {
    type: 'bar'
  },
  series: [
    {
      name: 'sales',
      data: [30, 40, 35, 50, 49, 60, 70, 91, 125]
    }
  ],
  xaxis: {
    categories: [1991, 1992, 1993, 1994, 1995, 1996, 1997, 1998, 1999]
  }
}

var chart = new ApexCharts(document.querySelector('#chart'), options)
chart.render()
This will render the following chart

A little more than the basic
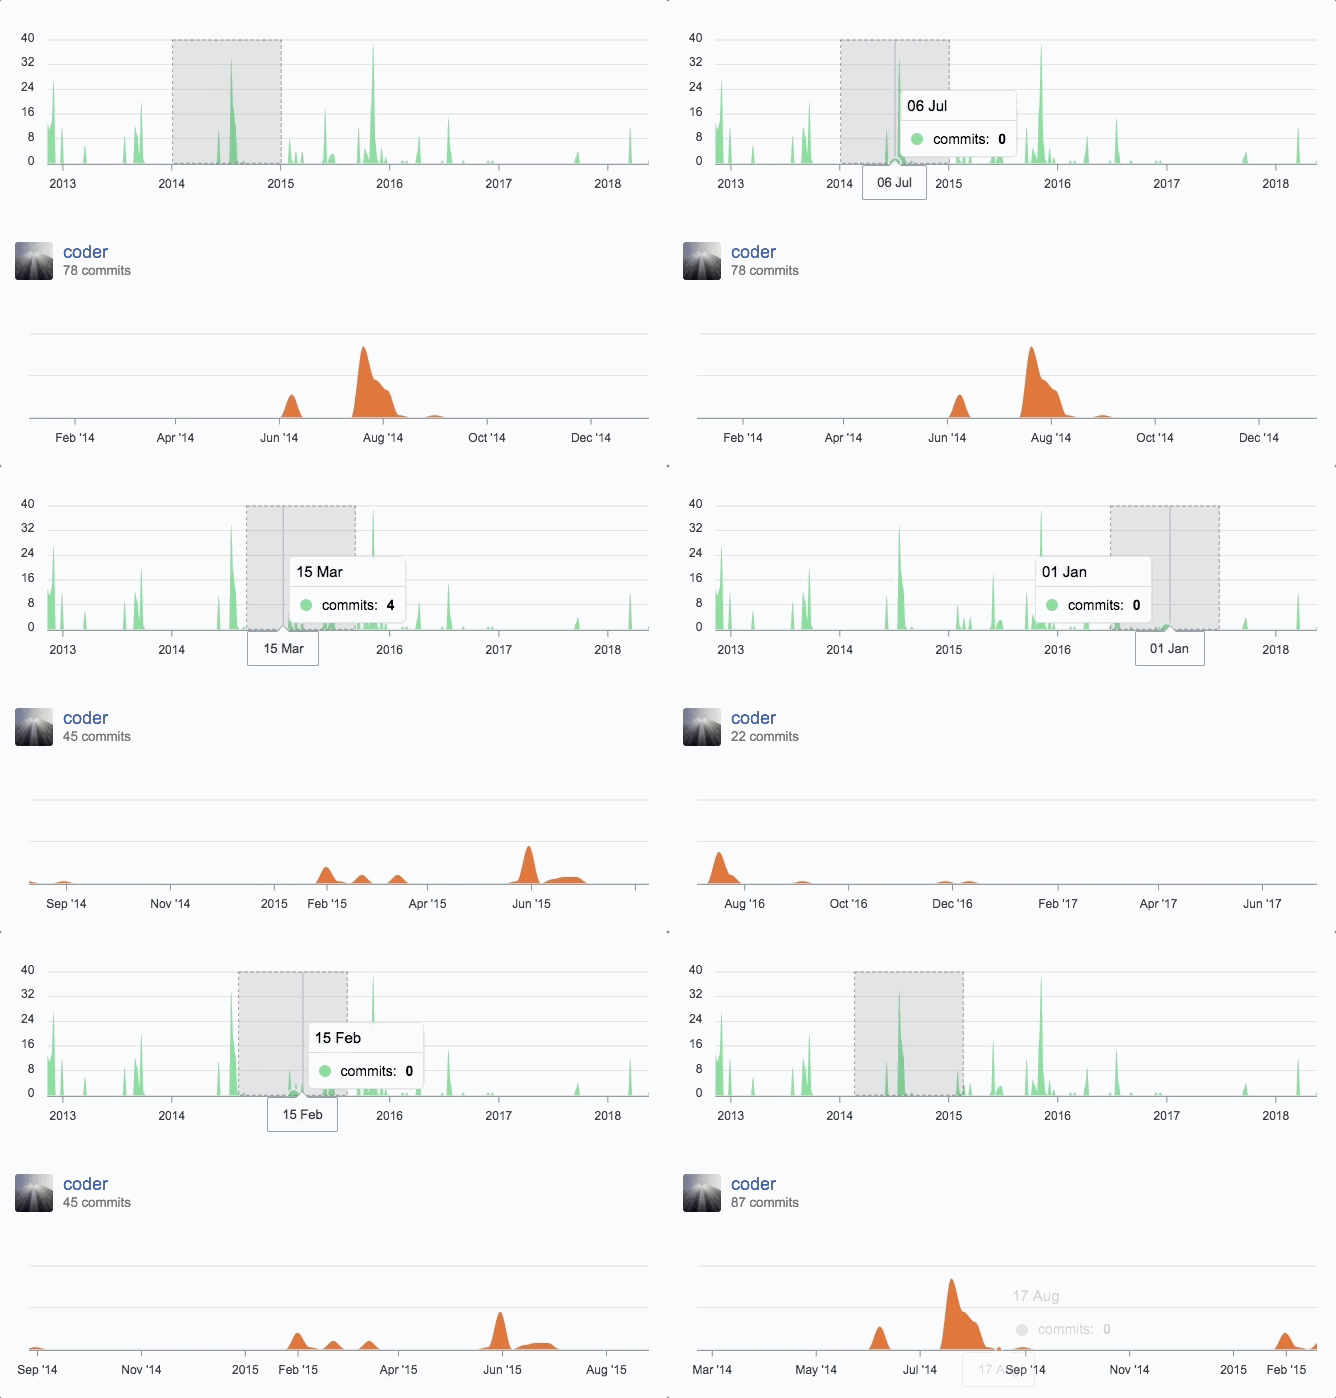
You can create a combination of different charts, sync them and give your desired look with unlimited possibilities. Below is an example of synchronized charts with github style.
Interactivity
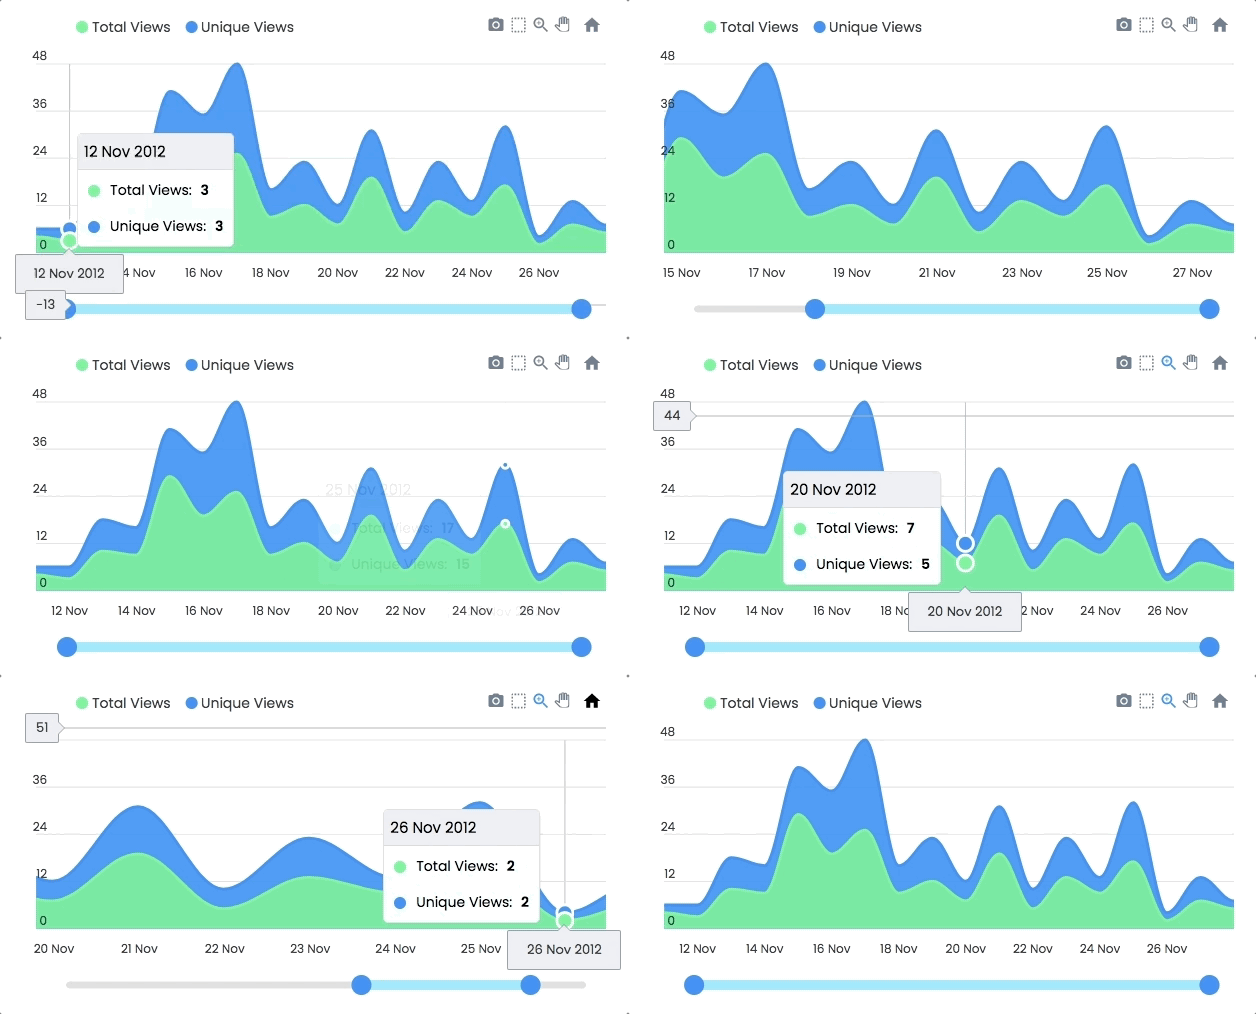
Zoom, Pan, and Scroll through data. Make selections and load other charts using those selections. An example showing some interactivity
Dynamic Series Update
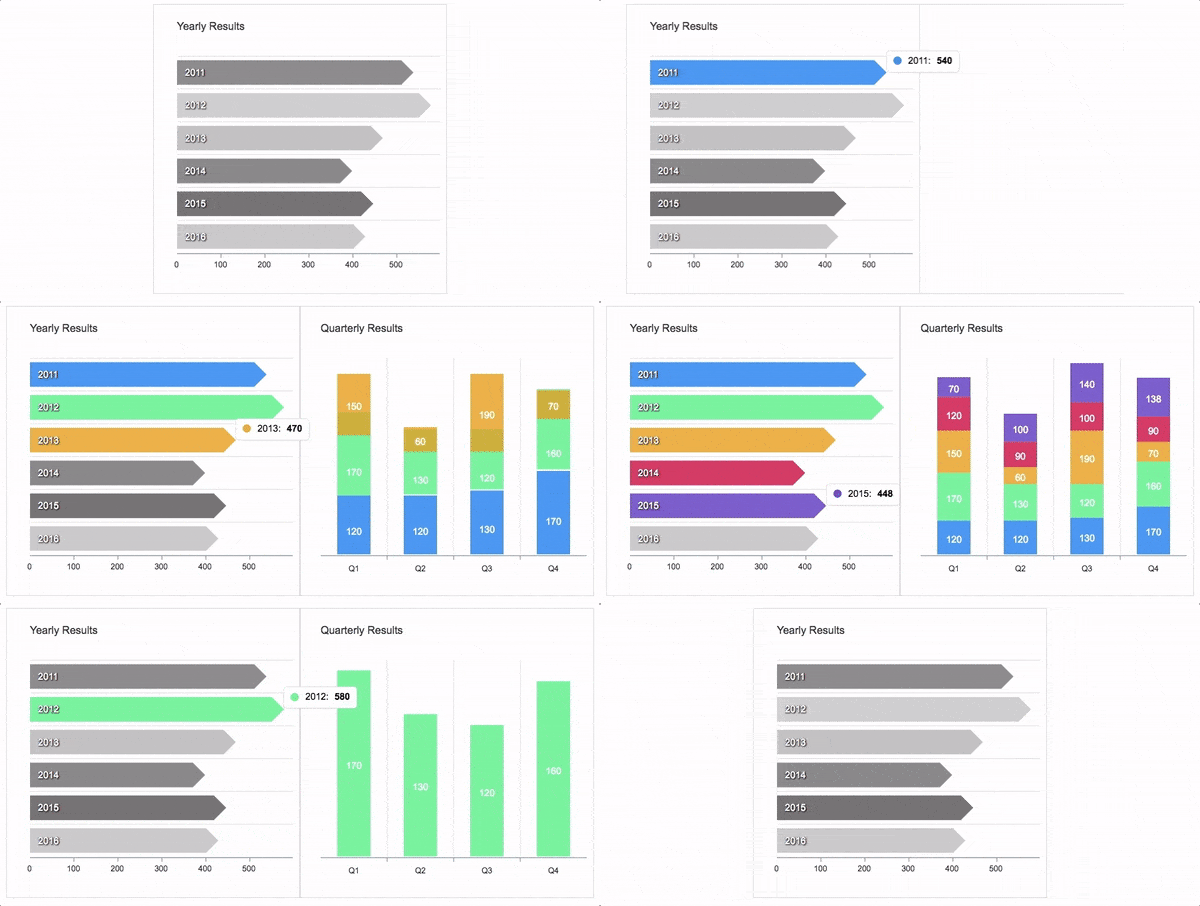
Another approach is to Drill down charts where one selection updates the data of other charts. An example of loading dynamic series into charts is shown below
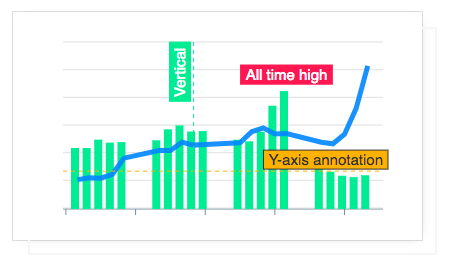
Annotations
Annotations allow you to write custom text on specific values or on axes values. Valuable to expand the visual appeal of your chart and make it more informative.
Mixed Charts
You can combine more than one chart type to create a combo/mixed chart. Possible combinations can be line/area/column together in a single chart. Each chart type can have its own y-axis.

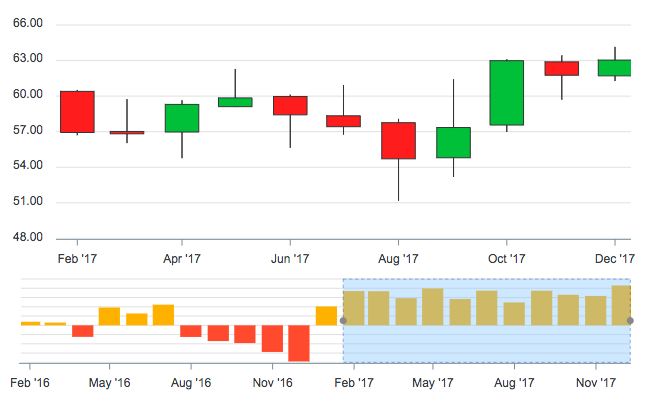
Candlestick
Use a candlestick chart (a common financial chart) to describe price changes of a security, derivative, or currency. The below image shows how you can use another chart as a brush/preview pane which acts as a handle to browse the main candlestick chart.
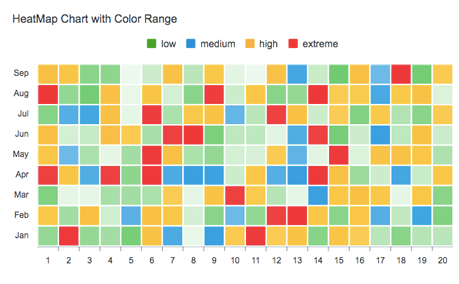
Heatmaps
Use Heatmaps to represent data through colors and shades. Frequently used with bigger data collections, they are valuable for recognizing patterns and areas of focus.
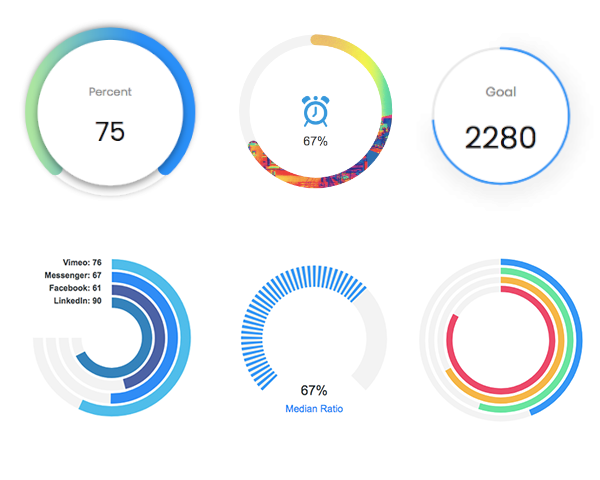
Gauges
The tiny gauges are an important part of a dashboard and are useful in displaying single-series data. A demo of these gauges:
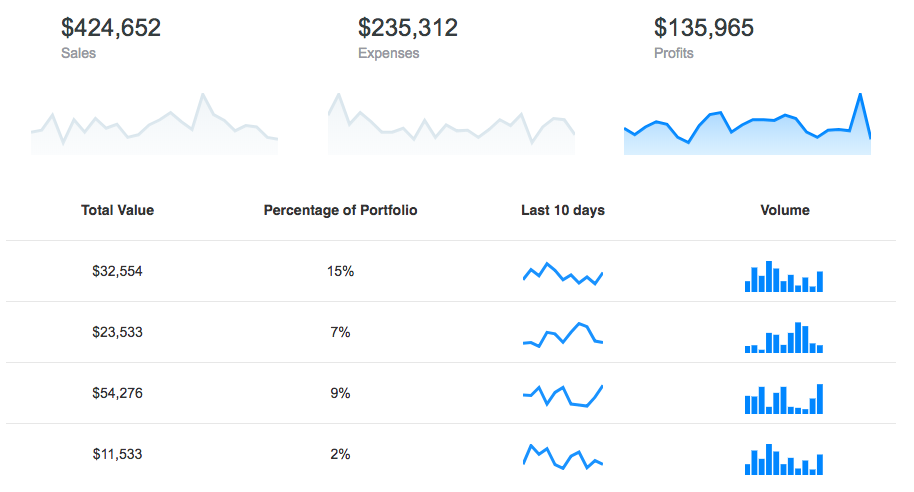
Sparklines
Utilize sparklines to indicate trends in data, for example, occasional increments or declines, monetary cycles, or to feature the most extreme and least values:
Need Advanced Data Grid for your next project?
We partnered with Infragistics, creators of the fastest data grids on the planet! Ignite UI Grids can handle unlimited rows and columns of data while providing access to custom templates and real-time data updates.
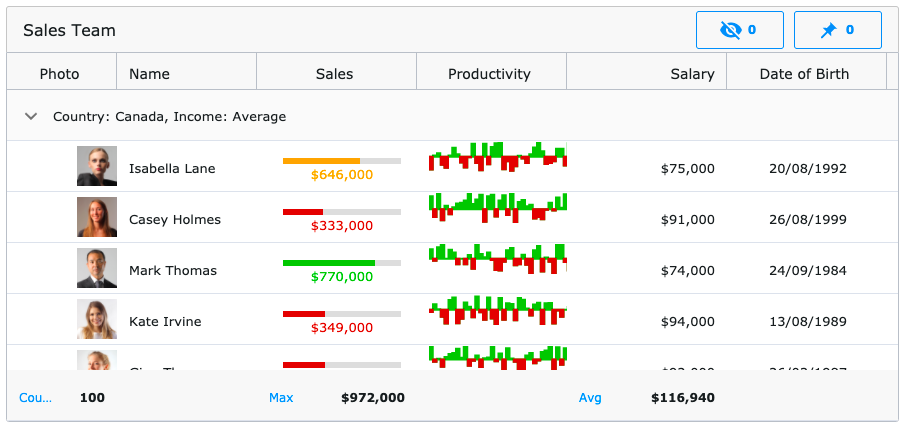
Featuring an intuitive API for easy theming and branding, you can quickly bind to data with minimal hand-on coding. The grid is available in most of your favorite frameworks:
Angular Data Grid | React Data Grid | Blazor Data Grid | Web Components DataGrid | jQuery Data Grid
What's included
The download bundle includes the following files and directories providing a minified single file in the dist folder. Every asset including icon/css is bundled in the js itself to avoid loading multiple files.
apexcharts/
├── dist/
│   └── apexcharts.min.js
├── src/
│   ├── assets/
│   ├── charts/
│   ├── modules/
│   ├── utils/
│   └── apexcharts.js
└── samples/
Using it with IE11
If you need to make it work with IE11, you need to include these polyfills before including ApexCharts
- promise-polyfill
- classlist.js
- ResizeObserver polyfill
- findIndex - You will need this only if you require timeline/rangebar charts
- canvg - You will need this only if you require PNG download of your charts
Development
Install dependencies and run the project
npm install
npm run dev
This will start the webpack watch and any changes you make to src folder will auto-compile and output will be produced in the dist folder.
Minifying the src
npm run build
Where do I go next?
Head over to the documentation section to read more about how to use different kinds of charts and explore all options.
Contacts
Email: [email protected]
Twitter: @apexcharts
Facebook: fb.com/apexcharts
Dependency
ApexCharts uses SVG.js for drawing shapes, animations, applying svg filters, and a lot more under the hood. The library is bundled in the final build file, so you don't need to include it.
License
ApexCharts is released under MIT license. You are free to use, modify and distribute this software, as long as the copyright header is left intact.