
在轻量级图表仪上形成的统一层.
CandleKit统一了图表工具和扩展开发者从轻量级图表生态系统中反复从源头,适应和维护.
绘制工具 • 技术指标 • 重放引擎 • 测量工具 • 同步多板块系统 • 经纪人集成
别缝合仓库了.
获得一个连贯的工具包,一致的API,以及一个为生产级财务制图而建造的可扩展的架构.
所有你不断在轻量级图表仪周围重建的东西——一次包装.


[注] Candlekit是一个气温编码的项目 ——与AI辅助开发一起迅速并迭代地设计和建设. 没错 已测试的功能CI 绿色,下面有一个维特套房
/tests),并记录在案,但将其作为早期软件处理: 给一个版本打针,在升级前读取更改日志,如果有东西退缩,则打开一个问题.
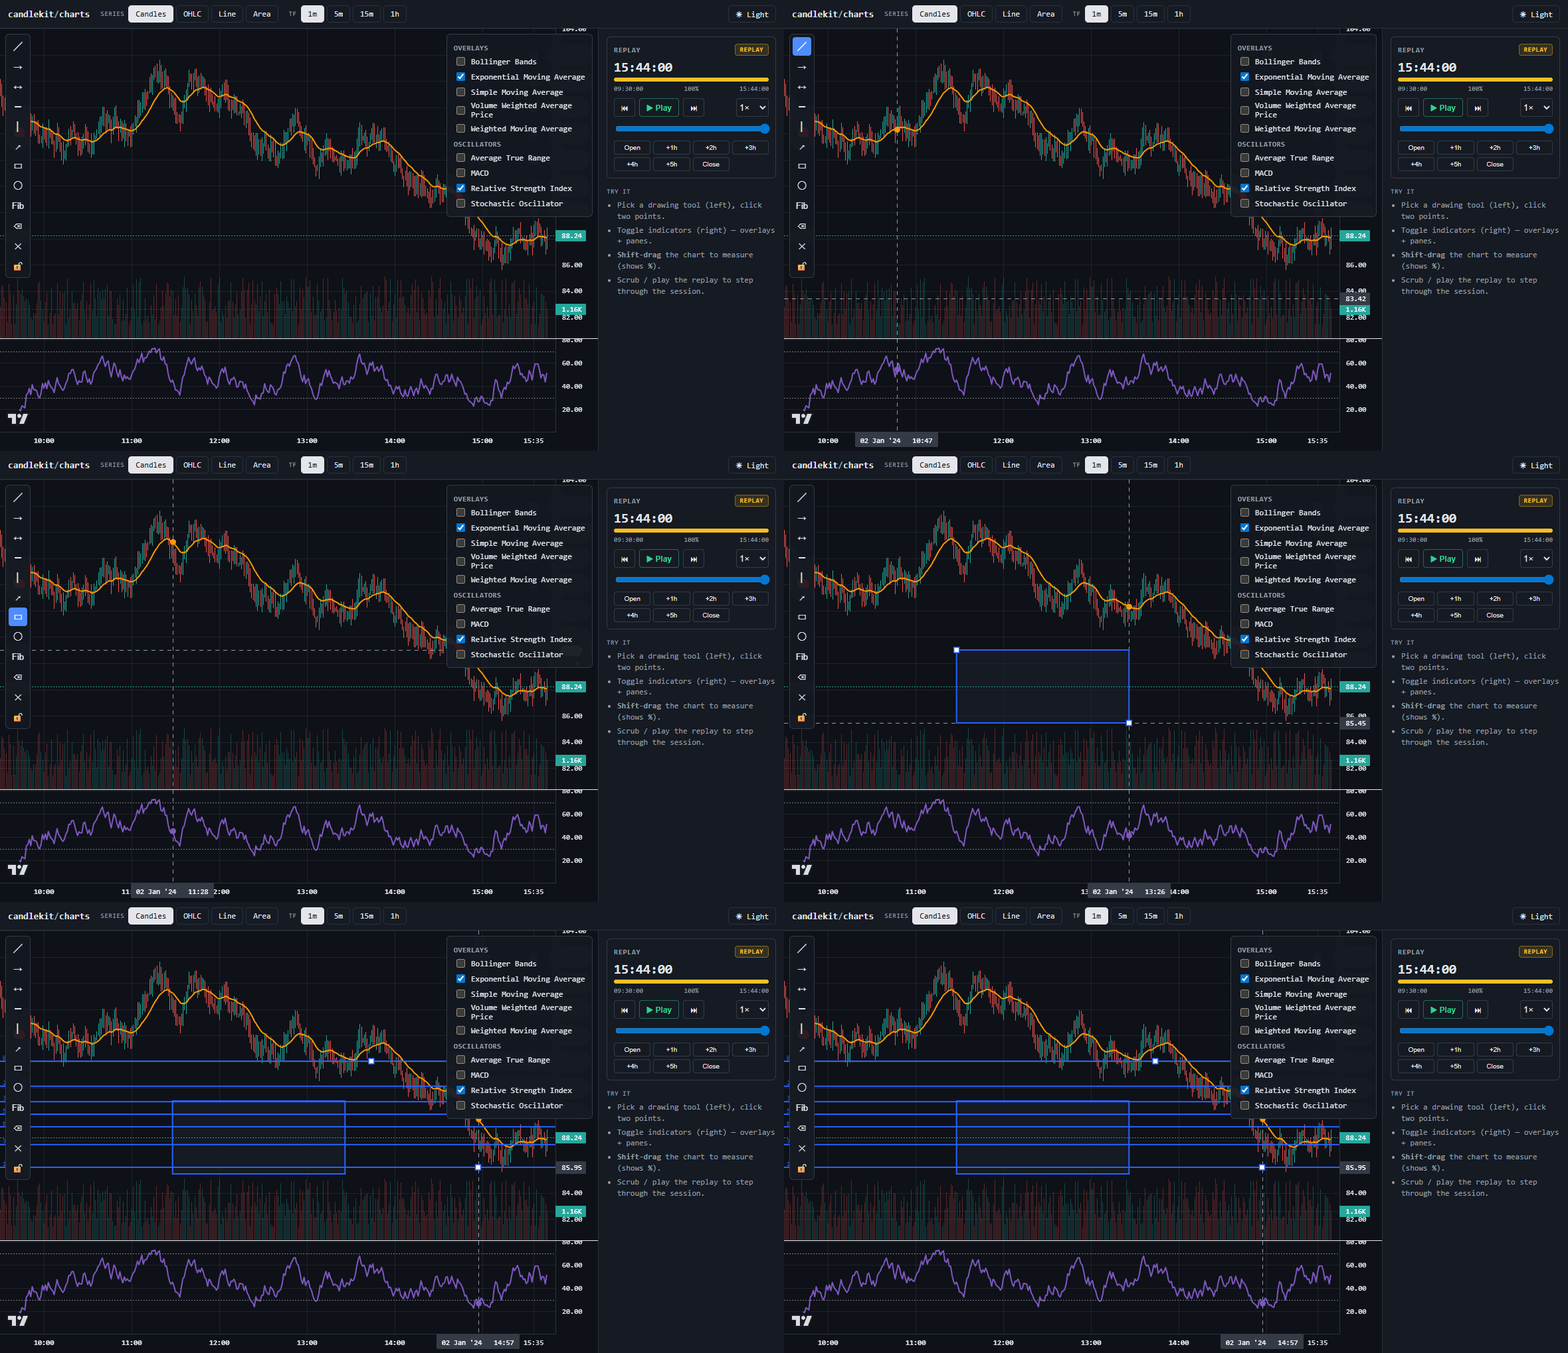
绘图工具——趋势线,矩形,Fibonacci,测量尺
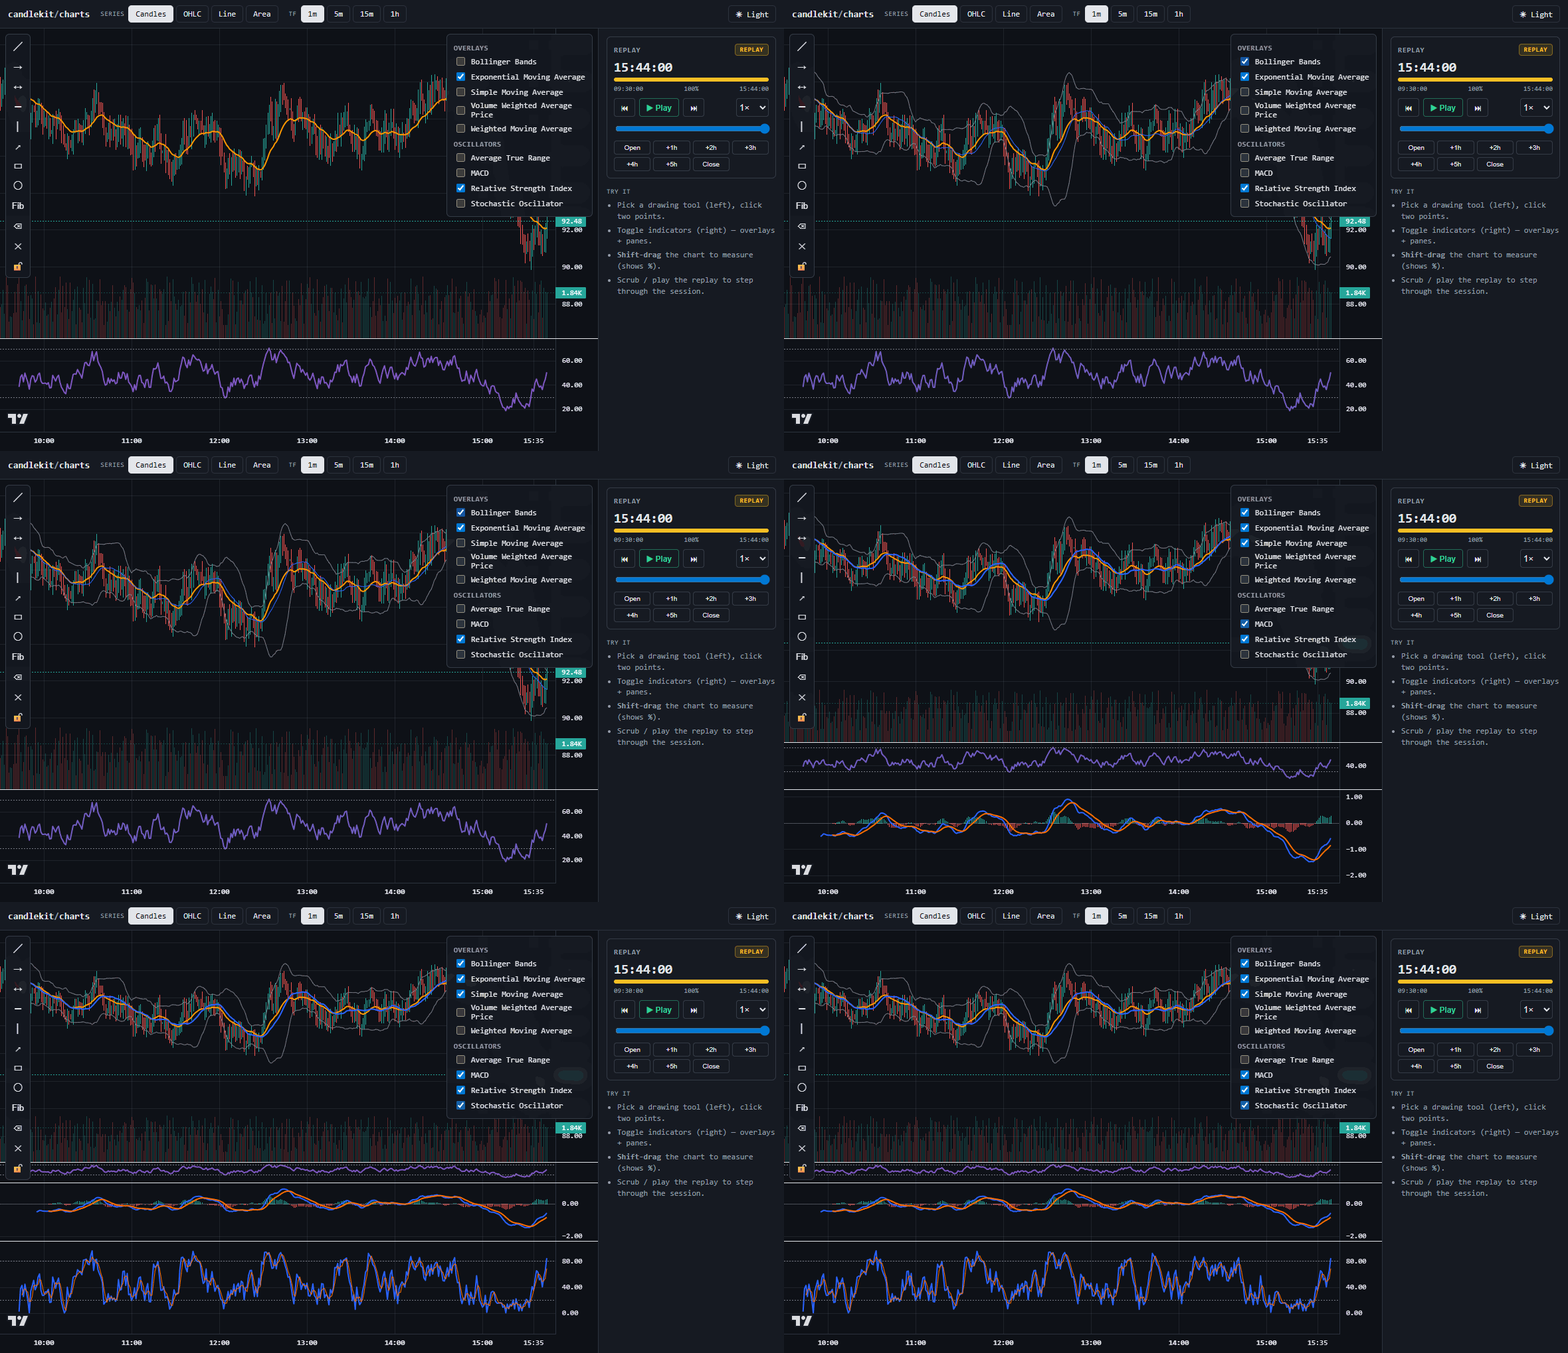
内建指标——Bollinger、EMA/SMA、RSI、MACD、Stochastic——切换活性
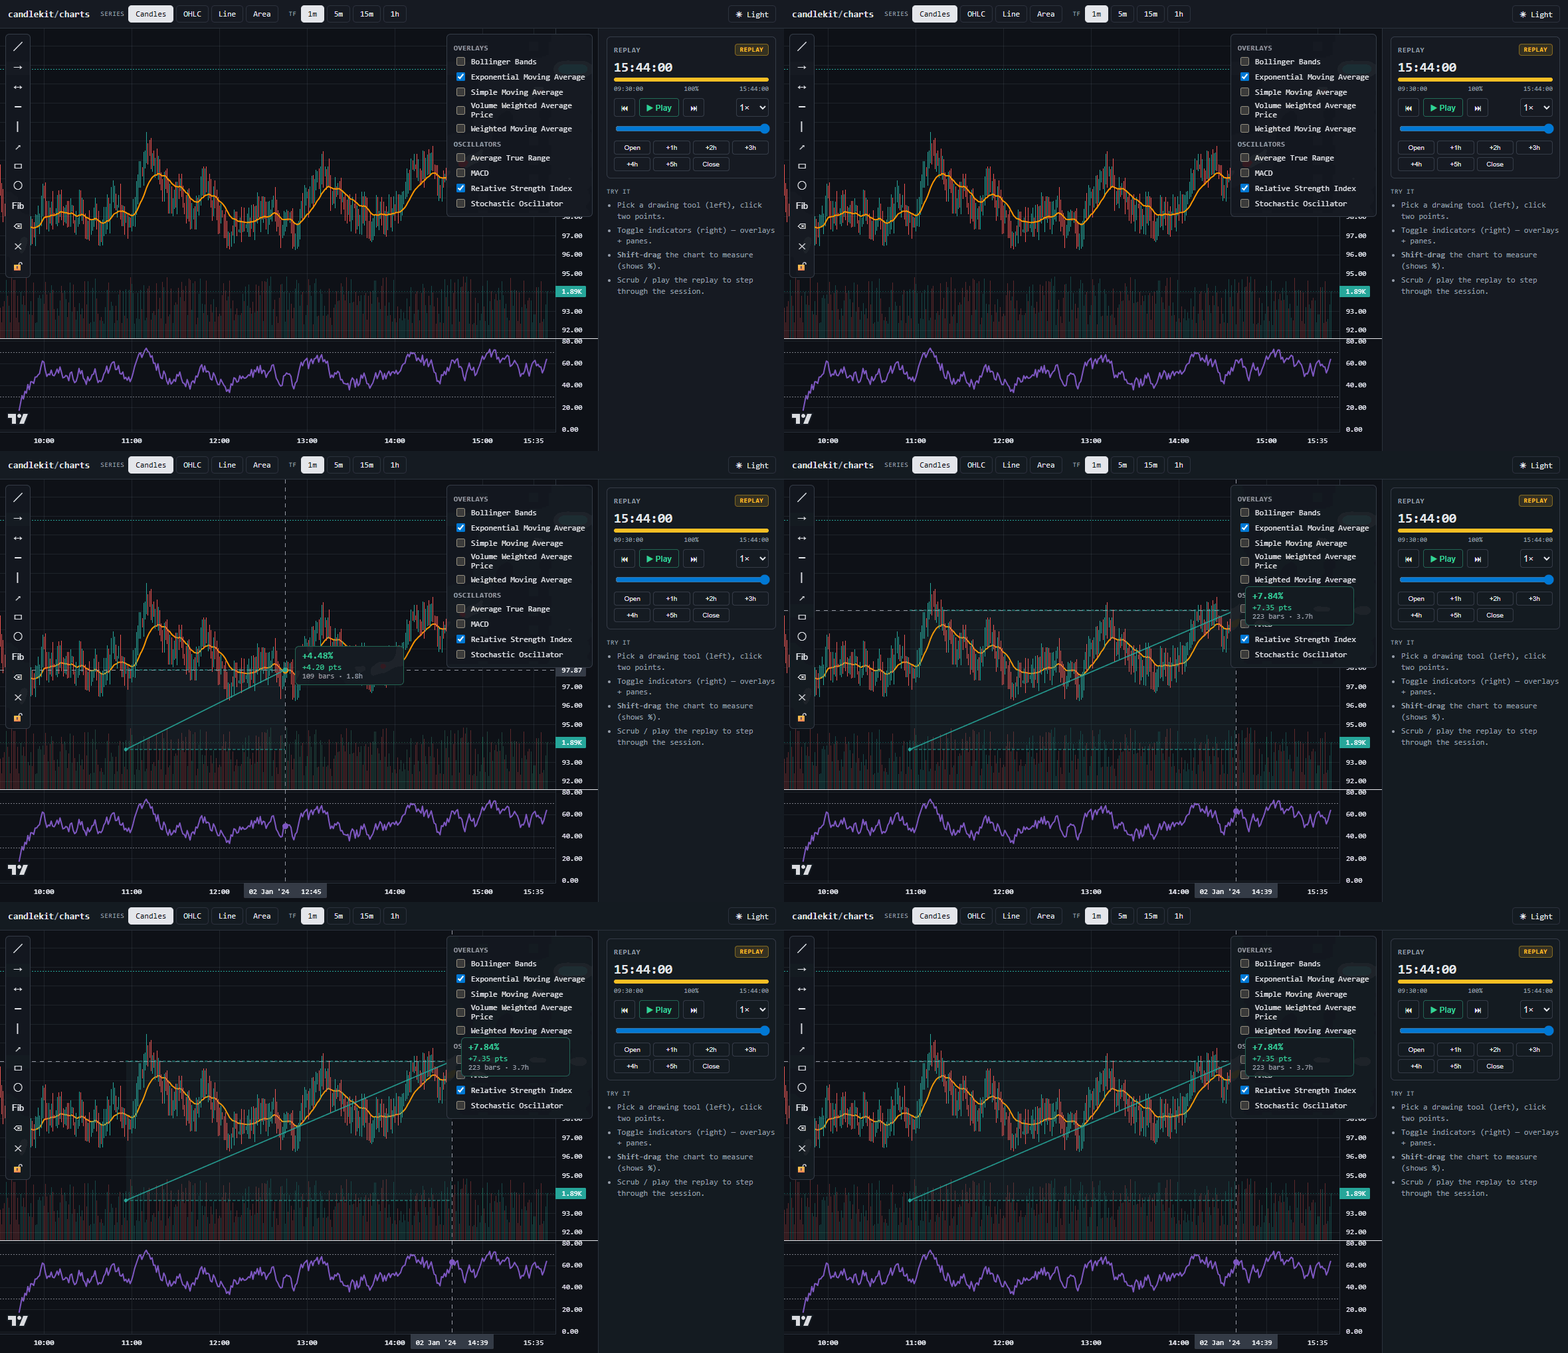
测量标尺 — % 移动、 点、 栏的 Shift- drag 时间
打开现场演示 ——一图中的绘画,指标,测量和回放
概览
candlekit/charts 将轻量级图与棋子包裹成真正的交易 UI
需要,但基础库留给您:稳定的图表控制器, a
运行时间不可知绘图引擎、可扩展的指标框架、 Shift- Drag
测量标尺、多图同步、中介整合和确定历史重放
发动机。 这个 核心为框架不可知性 (无反应,无DOM框架)
选项 /react 条目 添加组件和钩.
没错 插件第一个:绘图、指标和衡量 ChartPlugin编号
您可以互换、扩展或省略。 绘图工具和指标 原始代码
由轻量级图画布所建 – 没有第三方绘图或指示器
运行时间——和无副作用模块让树摇放出任何你没有的
导入.
特征
- 核心制图 - 烛台、OHLC栏、行、区、体积 通过会话感知重印、响应性自动调整大小、轻/暗的时间框架 带有全色覆盖的主题.
- 绘图工具 ——趋势线,射线,延伸线,水平线/垂直线, 箭头 矩形 圆形 Fibonacci再追踪 带有选择 拖动, 手柄重塑、锁定和持续。 原引擎打开 轻量级图画布原始人——无第三方绘图运行时间.
- 指标 - 登记册的可扩展性+内置目录(SMA、EMA、WMA、WMA、WMA、WAA、WA、WA、WA), VWAP, Bollinger Bands, RSI, MACD, ATR, Stochastic), 均为原作 执行。 登记你自己的电话.
- 计量 - 价格、百分比、酒吧-距离、时间-德尔塔和 风险/报酬,被画成画布尺.
- 重播 ——对历史栏目的决定性回放:播放/暂停,步 ±1, 速度控制, 搜索/ 跳动, 每栏事件钩, 每日 LRU 缓存 预取.
- 实验室(实验) ——图案类同性分析在自己栏杆上. 回声 ("market déjà vu") 发现历史的窗口 看起来像 最近的价格行动,带宽, 并预测发生的事情的中位数 下一个; 速记搜索 匹配您根据历史绘制的自由手形状. 纯,无依赖的数学+可选插件和一个回放面板.
- 建筑 – TypeScript,已完全打入公共API,可树动的无害环境管理+ CJS,事件系统,插件系统,以及可扩展的数据源/指标 / 绘制框架.
重播

决定重放——播放/暂停,第±1步,速度控制,搜索/跳出
实验室 — sketch 搜索和回声
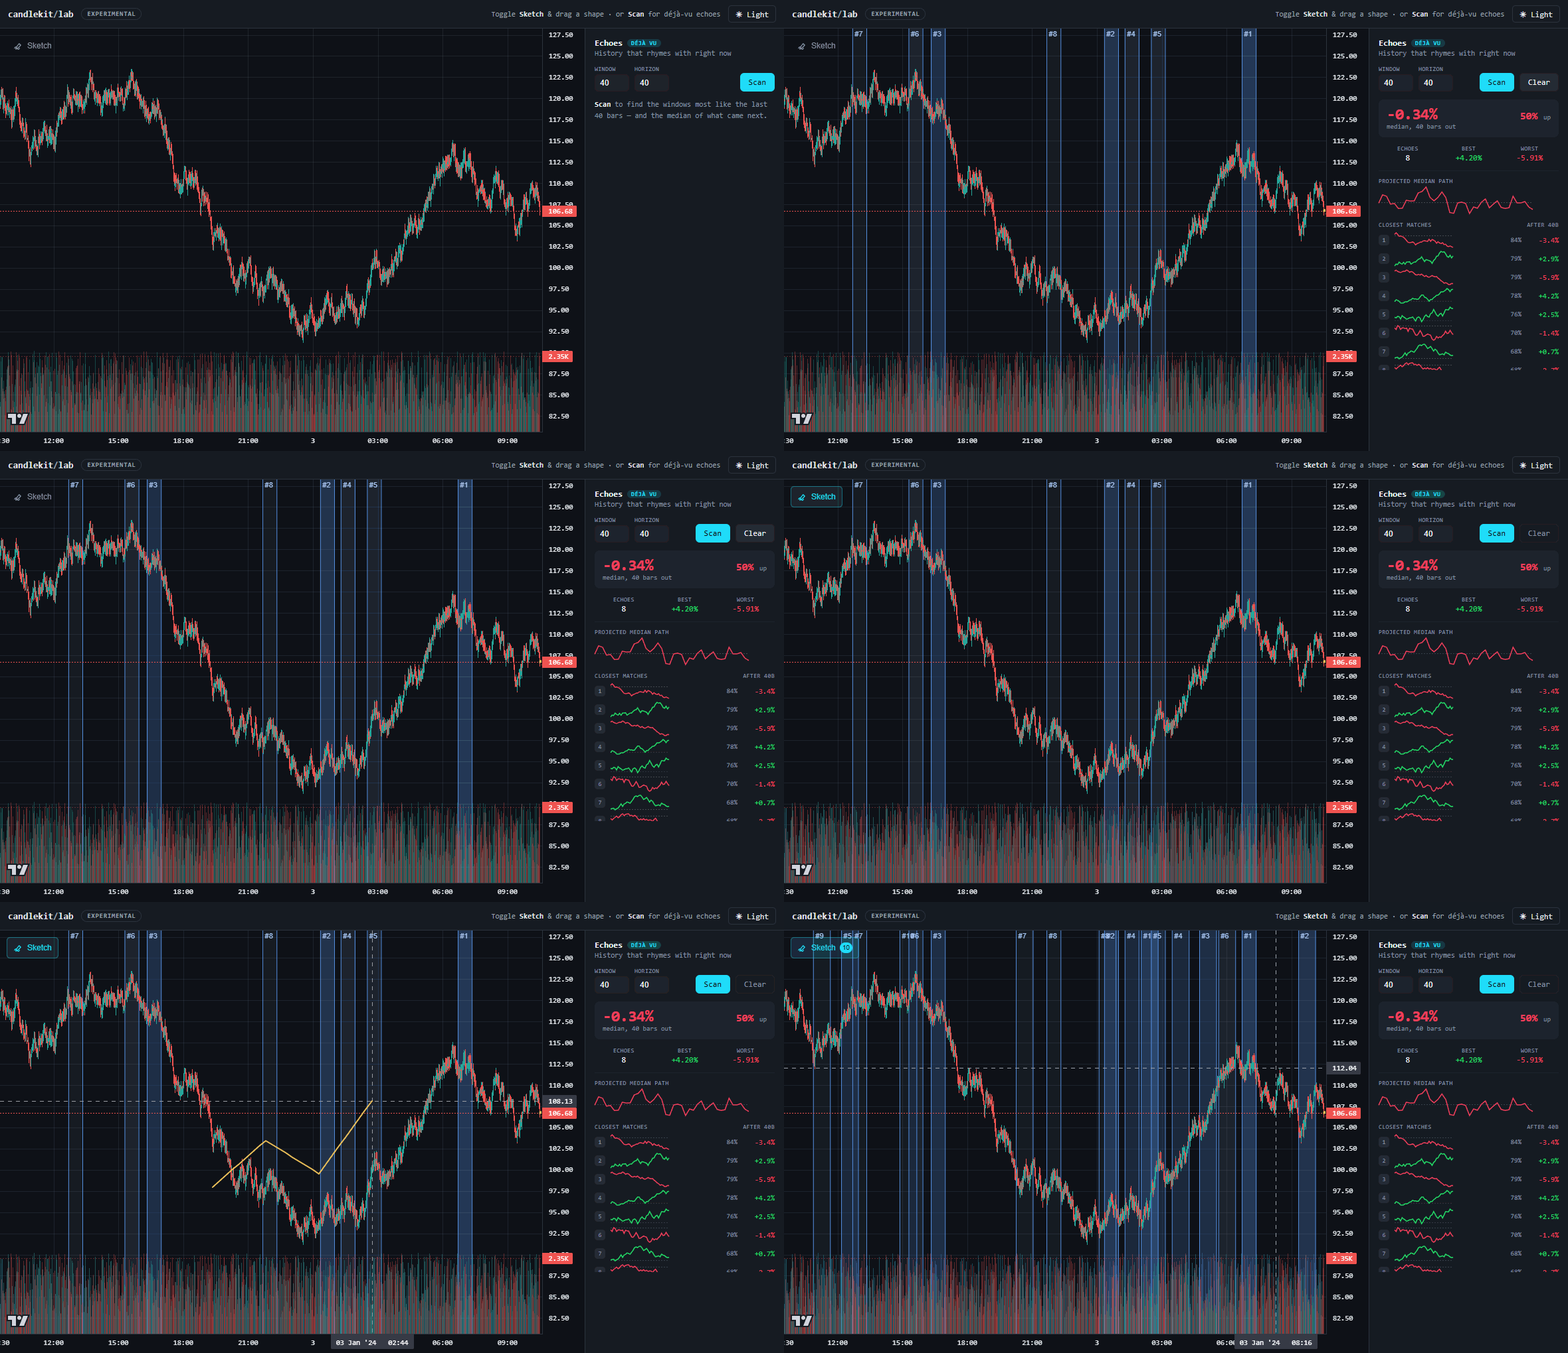
回声 — 相近的过去窗口 + 中位投影 — sketch 搜索 — 画出形状, 找到类似外观
两个实验性图案相似性工具,计算于 z 态化 关闭 (形状,不是价格水平),所以不同制度之间都可以看到相貌相:
- 回声 - 拿走最后一个 无 关闭为查询,查找最相似 历史上不重叠的窗口,在图表上带宽,并预测 接下来发生的中位数 从最后一个栏向前.
- 速记搜索 ——在图表上画出自由手的形状;再印 也以同样的方式与历史相匹配.
数学( E)zNormalize, (中文(简体) ), findSimilar, (中文(简体) ), buildEchoScan, (中文(简体) ), resampleStroke)为
纯和无依赖性; 图表插件( e)SketchSearchController, (中文(简体) ),
EchoesController)和反应 <EchoesPanel> 编号 : <SketchSearchButton> 为:
选项。 见 实验室实例 全文
实验室指南,以及 实例/栏 一个可运行的演示.
试着住进去 实例/栏 (单位:千美元)
cd examples/lab && npm i && npm run dev) (中文(简体) ). 上面的GIF由SCENE=lab node scripts/capture-demo.mjs。 。 。 .
安装
npm install @getcandlekit/charts lightweight-charts
# React bindings (optional):
npm install react react-dom
就是这样. lightweight-charts 只有运行时间依赖(对等者,所以您
控制其版本; react编号 :react-dom 仅用于
@getcandlekit/charts/react。 。 。 . 绘图工具和指标载于 没有
额外软件包,不安装 git .
快速启动
香草JS/类型脚本
import { ChartController, toBars } from "@getcandlekit/charts";

const el = document.getElementById("chart")!;
const chart = new ChartController(el, { theme: "dark", seriesType: "candlestick" });

chart.setData(toBars(myRows)); // myRows: { ts, open, high, low, close, volume }[]
反应
import { ChartView } from "@getcandlekit/charts/react";
import "@getcandlekit/charts/styles.css";

export function App({ bars }) {
  return (
    <div style={{ height: 480 }}>
      <ChartView data={bars} seriesType="candlestick" theme="dark" />
    </div>
  );
}
基本实例
切换序列类型和时限 :
chart.setSeriesType("area");       // candlestick | ohlc | line | area
chart.setData(resample(rows, 5));  // 5-minute candles from 1-minute rows
chart.setTheme("light");
实时更新 :
ws.onBar((bar) => chart.updateBar(bar)); // appends or replaces the last bar
高级示例
会话意识复刻 (将桶装到09: 30的市场开放,而不是UTC午夜):
import { resample } from "@getcandlekit/charts";
const candles = resample(rows, 15, { sessionOpenMinutes: 9 * 60 + 30 });
固定抵销的交换时间 (以一站一站一站一站一站一站一站一站一站一站一站一站一站一站一站一站一站一站一站一站一站一站一站一站一站一站一站一站一站一站一站一站一站一站一站一站一站一站一站一站一站一站一站一站一站一站一站一站一站一站一站一站一站一站一站一站一站一站一站一站一站一站一站一站一站一站一站一站一站一站一站一站一站一站一站一站一站一站一站一站一站一站一站一站一站一站一站一站一站一站一站一站一站一站一站一站一站一站一站一站一站一站一站一站一站一站一站一站一站一站一站一站一站一站一站一站一站一站一站一站一站一站一站一站一站一站一站
import { applyFixedOffset } from "@getcandlekit/charts";
const shifted = rows.map((r) => ({ ...r, ts: applyFixedOffset(r.ts, 330) }));
重放实例
import { createReplayController } from "@getcandlekit/charts";

const replay = createReplayController();
replay.onBar((e) => chart.updateBar(e.bar));
await replay.load({
  id: "demo",
  series: [{ symbol: "AAPL", interval: "1m" }],
  start: Date.parse("2024-01-02T14:30:00Z"),
  end: Date.parse("2024-01-03T21:00:00Z"),
  source: myReplayDataSource, // implements ReplayDataSource
});
replay.setSpeed(8);
replay.play();
反应运输栏 :
import { ReplayControls } from "@getcandlekit/charts/react";
<ReplayControls controller={replay} />
绘图工具示例
import { ChartView, DrawingToolbar } from "@getcandlekit/charts/react";

// `drawing` accepts true, an options object, or a DrawingController instance.
<ChartView data={bars} drawing={{ storageKey: "drawings:AAPL" }}>
  <DrawingToolbar />
</ChartView>;
必要性( vanilla ):
import { ChartController, DrawingController } from "@getcandlekit/charts";

const chart = new ChartController(el);
const drawing = new DrawingController({ storageKey: "drawings:AAPL" });
chart.use(drawing);
drawing.engine.startTool("TrendLine");
指标
import { ChartView, IndicatorPicker, IndicatorController, createBuiltinRegistry } from "@getcandlekit/charts/react";

const indicators = new IndicatorController(createBuiltinRegistry());
indicators.add("RSI", { length: 14 });
indicators.add("EMA", { length: 21 });

<ChartView data={bars} indicators={indicators}>
  <IndicatorPicker />
</ChartView>;
登记a 自定义指标 (扩展点):
import { IndicatorRegistry } from "@getcandlekit/charts";

const registry = new IndicatorRegistry().register({
  name: "PriceMid",
  title: "HL/2",
  shortTitle: "MID",
  category: "overlay",
  defaultInputs: {},
  inputConfig: [],
  plotConfig: [{ id: "mid", color: "#f59e0b" }],
  hlineConfig: [],
  calculate: (bars) => ({
    plots: { mid: bars.map((b) => ({ time: b.time, value: (b.high + b.low) / 2 })) },
  }),
});
实验室实例
反应( E)<ChartView> 主机插件; 组件驱动它们 :
import { ChartView, SketchSearchButton, EchoesPanel } from "@getcandlekit/charts/react";
import "@getcandlekit/charts/styles.css";

<ChartView data={bars} sketch echoes={{ windowLen: 30, horizon: 30, k: 8 }}>
  <SketchSearchButton />  {/* toggle, then drag a shape on the chart */}
  <EchoesPanel />         {/* Scan → bands + median projection + stats */}
</ChartView>;
必要性( vanilla- 相同的插件, 您自己的用户界面) :
import { ChartController, EchoesController, SketchSearchController } from "@getcandlekit/charts";

const chart = new ChartController(el);
chart.setData(bars);

const echoes = new EchoesController({ windowLen: 30, horizon: 30, k: 8 });
chart.use(echoes);
echoes.subscribe((scan) => scan && console.log(scan.stats)); // { count, upCount, medianEndPct, ... }
echoes.run();

const sketch = new SketchSearchController({ onResult: (r) => console.log(r?.matches) });
chart.use(sketch);
sketch.setActive(true); // arm; drag a freehand shape, release to search
纯数学, 没有图表( 搜索任何闭合序列) :
import { findSimilar, buildEchoScan } from "@getcandlekit/charts";

const matches = findSimilar(closes, closes.slice(-30), { k: 5 }); // [{ startIndex, endIndex, distance }]
const scan = buildEchoScan(bars, 30, 30, 8);                      // window/horizon/k → null if too little history
插件示例
import type { ChartPlugin } from "@getcandlekit/charts";

const lastPriceLabel: ChartPlugin = {
  id: "last-price-label",
  init(ctx) {
    ctx.bus.on("data", ({ bars }) => {
      const last = bars[bars.length - 1];
      if (last) console.log("last close", last.close);
    });
  },
  destroy() {},
};

chart.use(lastPriceLabel);
API 概览
| 导出 | 仁爱 | 目的 |
|---|---|---|
ChartController | 类 | 强制性图表包 (数据,系列类型,主题,插件,事件). |
toBars, (中文(简体) ), resample, (中文(简体) ), floorToBucket | fn 时 | 纯数据正常化+会话意识再生. |
resolveTheme, (中文(简体) ), lightTheme, (中文(简体) ), darkTheme | 页:1 | 主题预设+分辨率. |
EventBus | 类 | 已键入同步事件总线 . |
DrawingController, (中文(简体) ), DrawingEngine | 类 | 内建绘图插件+其模型/状态. |
IndicatorRegistry, (中文(简体) ), IndicatorController, (中文(简体) ), createBuiltinRegistry | 类别/小时 | 可扩展的指标框架+内置目录. |
MeasurementController, (中文(简体) ), RulerPrimitive | 类 | 相向干道测量. |
createReplayController | fn 时 | 决断重出. |
createSyncEngine | fn 时 | 多图同步. |
EchoesController, (中文(简体) ), SketchSearchController | 类 | 实验室插件 — Echoes (déjà vu) + sketch search. |
findSimilar, (中文(简体) ), buildEchoScan, (中文(简体) ), zNormalize, (中文(简体) ), resampleStroke | fn 时 | 纯图-同义数学(无图). |
ChartView (/反应) | 组件 | 声明图 + 插件主机. |
EchoesPanel, (中文(简体) ), SketchSearchButton (/反应) | 组件 | 实验室结果面板+草图切换. |
全文 : 文件/参考文献。 。 。 .
业绩说明
- 数据边界的单相抵转换;绘图/重放停留在一个 坐标域(没有每个时区数学).
setData自动缩放符合第一次非空漆一次; 后期更新 保存用户泛/分区.- 重放使用每天的 LRU 缓存, 并带有后向/ 前向预缩写; 光标 驱动一切(无墙钟接合).
- 可树摇晃的无害环境管理——香草包从不拉回放. 绘图和 指标是自成一体的(没有额外的运行时间来加载).
浏览器支持
常绿浏览器(Chrome, Edge, Firefox, Safari)有Canvas + 缩放观察员.
无害环境管理和CJS大楼已运出; target: es2020。 。 。 .
路线图
- 文本 + 自由手/ 刷子绘图工具
- React picker 中的指标设置 UI( param 编辑)
- 十字架工具提示组件
- 更多指标( Ichimoku, SuperTrend, Keltner)
- Vue / 丝绒绑定
- 截图/导出助手
恒星历史
如果蜡烛可以让你避免缝合.
捐款
见 捐款额 财务报告和审定财务报表 一般事务人员(其他职等)简言之:
npm install, (中文(简体) ), npm run typecheck && npm run lint && npm run test && npm run build。 。 。 .
许可证
麻省理工学院——见 自由主义的第三方归属 通知。 。 。 . "轻量级图表TM"是TradingView, Inc.的商标;这个项目不是 隶属于贸易维尤.