@docx-editor.dev/telemetry
Anonymous diagnostics, metrics, and error reporting for @docx-editor.dev editors and collaboration servers. Send them to OpenTelemetry, Prometheus, Sentry, or your own logger.
Built-in diagnostics contain codes, booleans, bucketed sizes and counts, and timings. They exclude document text, file names, author names, font names, and room names. You control any attributes you add and any data your monitoring SDKs collect. The package sends data only through exporters you configure.
Install the package
The package is available in version 2.29.0 and later.
npm install @docx-editor.dev/telemetry @docx-editor.dev/core
Add @opentelemetry/api or @hocuspocus/server only for the exporters and server integrations that you use. The Sentry exporter takes the Sentry SDK your app already loads.
Editors
import { createTelemetry } from '@docx-editor.dev/telemetry';
import { otelExporter } from '@docx-editor.dev/telemetry/otel';
import { sentryExporter } from '@docx-editor.dev/telemetry/sentry';
import * as Sentry from '@sentry/react';

export const telemetry = createTelemetry({
  // Sentry for failures, OpenTelemetry for metrics such as typing delay.
  exporters: [sentryExporter(Sentry), otelExporter()],
  include: {
    documentOpen: true,
    documentSave: true,
    trackedChanges: true,
    editing: true,
    performance: true,
    sessions: true,
  },
  consent: () => consentManager.analytics === true, // your consent manager
});

// Outside your component, so the array is stable across renders:
export const MODULES = [telemetry.module];
// <DocxEditor document={bytes} modules={MODULES} />
Use consoleExporter() to view diagnostics during development. For example, the following diagnostic explains why the editing API refused a tracked picture deletion:
[docx-editor] edit refused: edit.tracked-operation-unsupported (automation, tracked)
  This editing API operation cannot be recorded as a tracked change, so nothing was applied. Use text edits such as range.insertText or range.delete, which tracking records. Never switch tracking off to make the edit succeed.
  https://docx-editor.dev/docs/2.x/guides/diagnostics#edit-tracked-operation-unsupported
The performance area measures typing delay and engine layout and paint times. Send it to an exporter that records metrics, such as otelExporter(). The Sentry exporter records performance only as breadcrumbs.
The sessions area counts editor sessions, active editing time, and edits by origin, so you can compute edit failure rates. The documentSave area reports each save() call with its outcome and duration. For queries and dashboards, see Measure sessions, edits, and saves.
Collaboration servers
import { Server } from '@hocuspocus/server';
import { withCollaborationTelemetry } from '@docx-editor.dev/telemetry/hocuspocus';
import { metricsHandler, prometheusRegistry } from '@docx-editor.dev/telemetry/prometheus';

const metrics = prometheusRegistry();
const { config, rooms } = withCollaborationTelemetry(
  { port: 1234, onAuthenticate, onLoadDocument, onStoreDocument },
  { exporters: [metrics] }
);
new Server(config);

app.get('/metrics', metricsHandler(metrics));
app.get('/admin/rooms', requireAdmin, (_request, response) => response.json(rooms.list()));
For other Yjs servers, use roomTelemetry from @docx-editor.dev/telemetry/server.
Dashboards
Grafana dashboards show editor input delay, engine timings, document opens, and refused edits. They also show collaboration rooms, people, memory, and refusals.
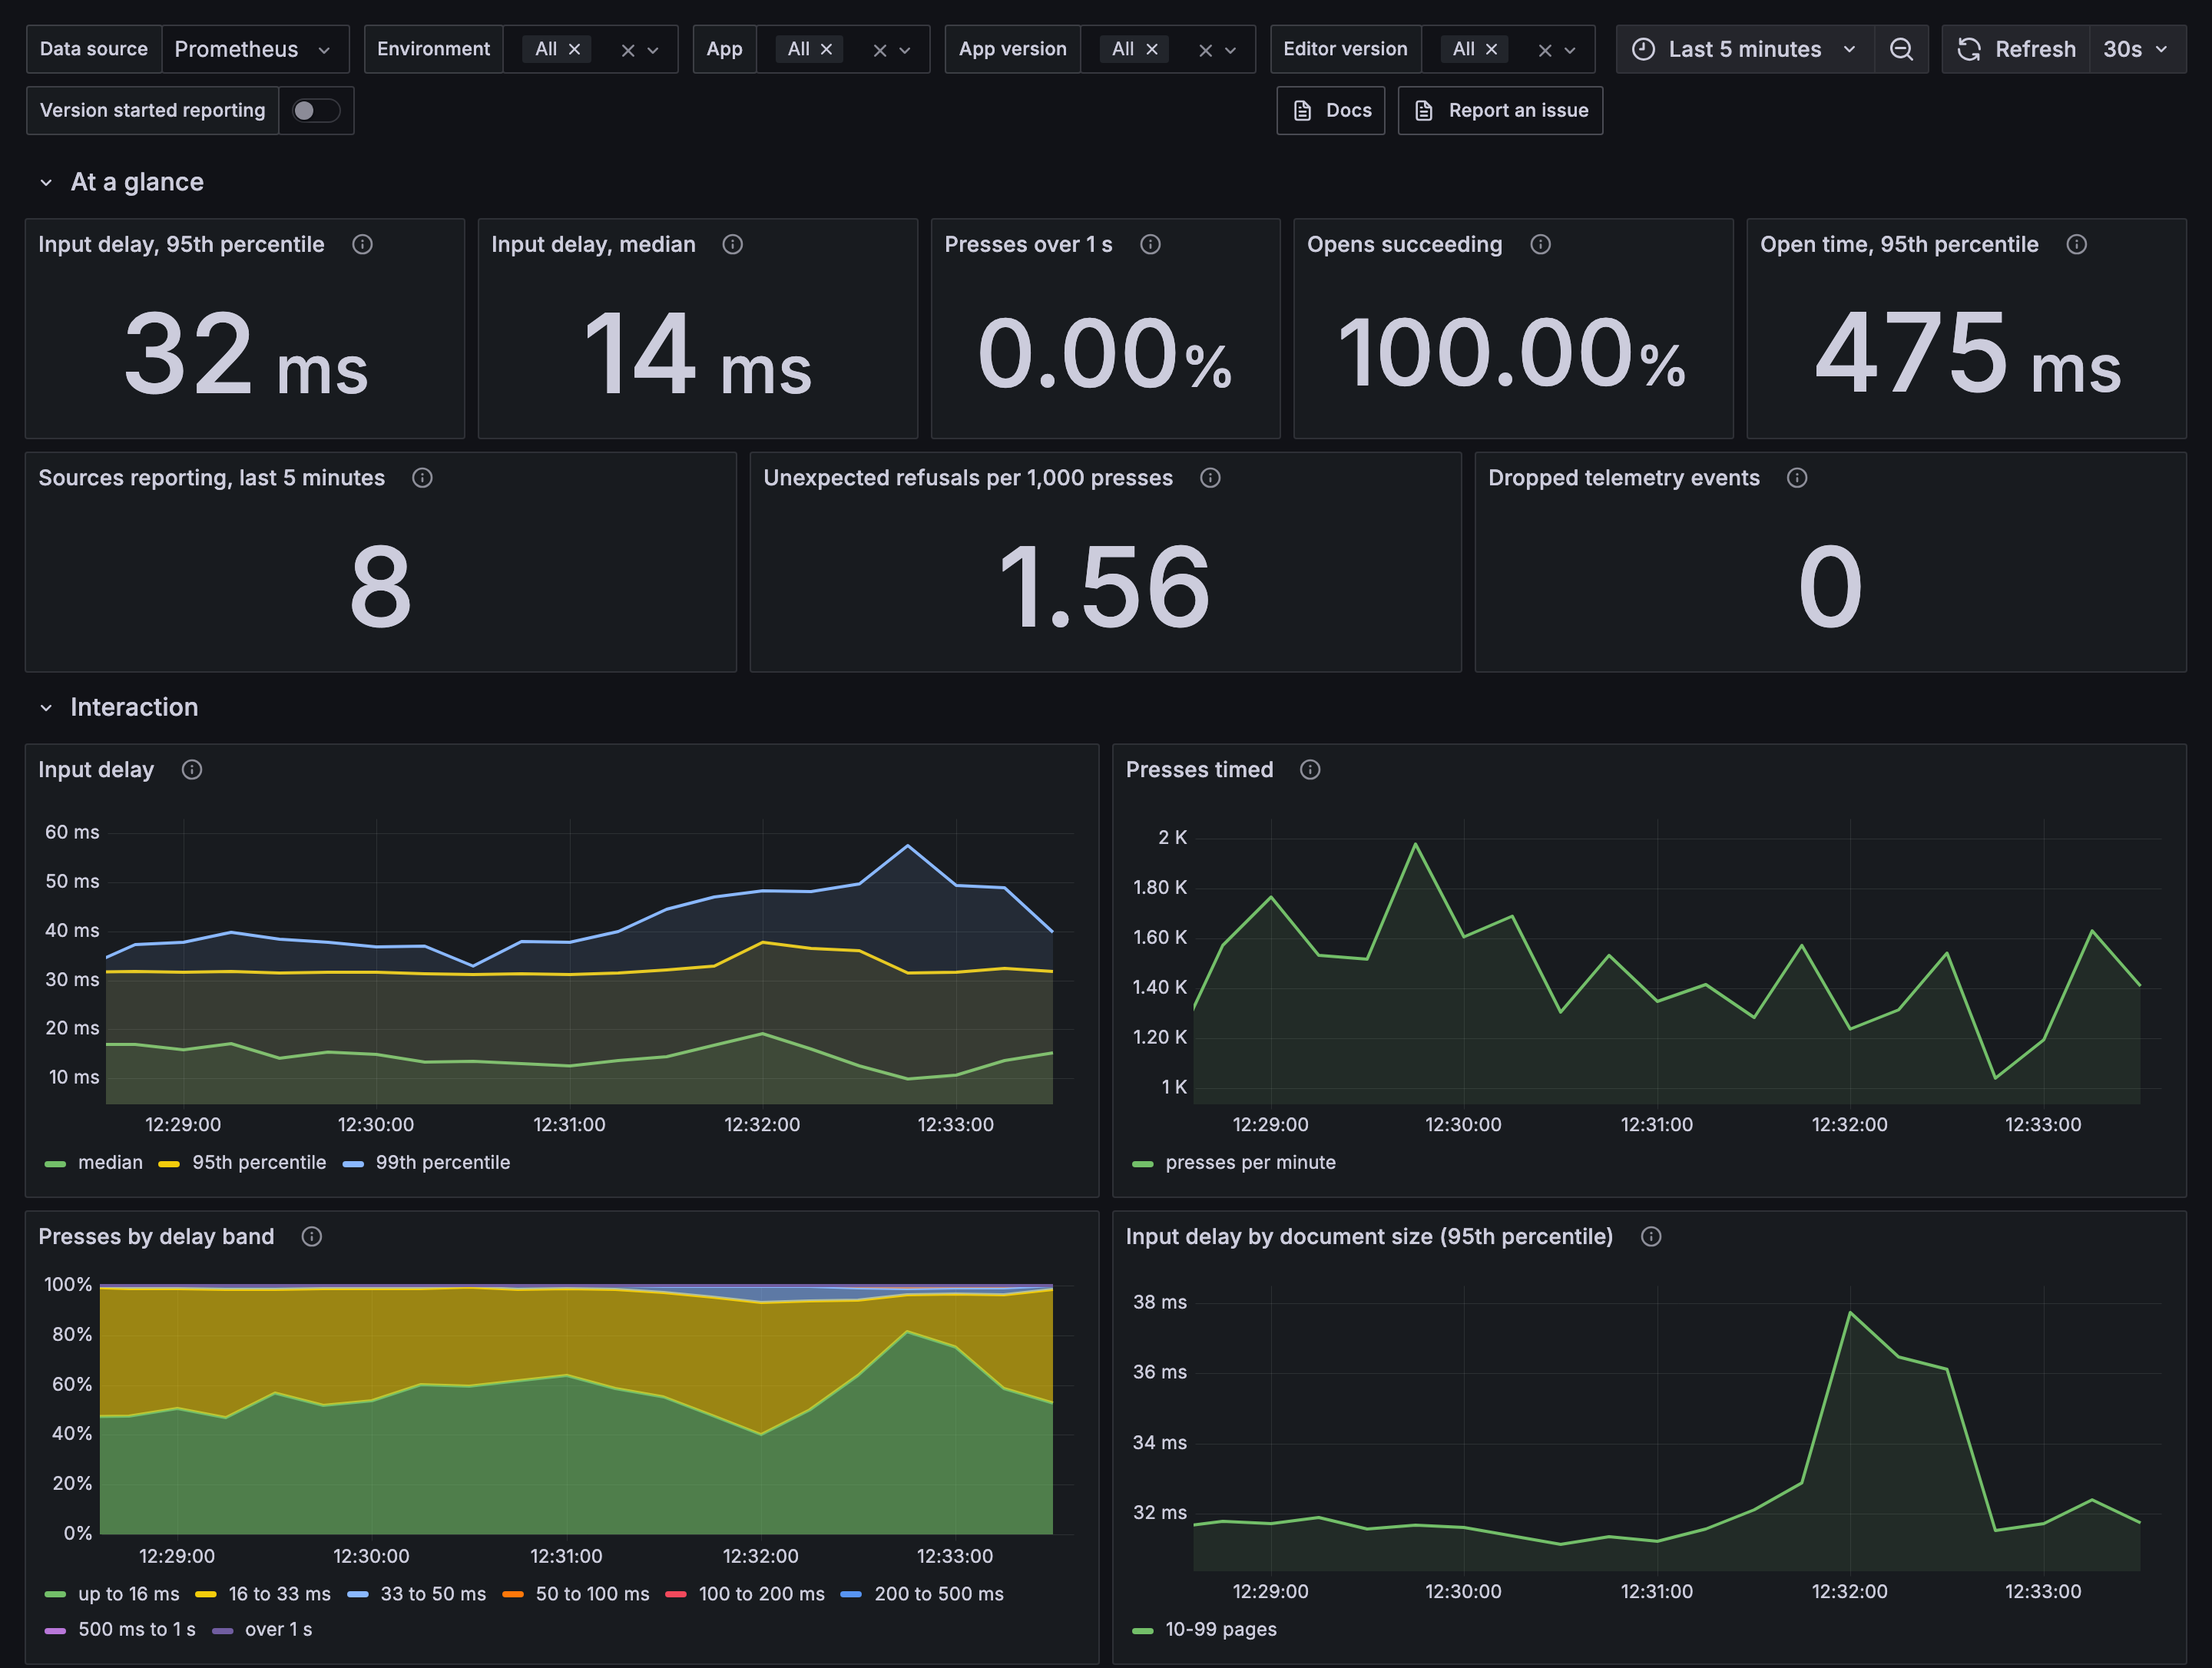
Download editor-experience.json and collaboration.json, then import them into Grafana. For the setup each one needs, see Dashboards.
Entry points
| Entry | Contents |
|---|---|
@docx-editor.dev/telemetry | createTelemetry, consoleExporter, callbackExporter, memoryExporter, isFailure, failureCount, explainDiagnostic, the metric catalog |
@docx-editor.dev/telemetry/otel | otelExporter, through your OpenTelemetry SDK |
@docx-editor.dev/telemetry/sentry | sentryExporter, dropEditorBreadcrumbs, EDITOR_SELECTORS |
@docx-editor.dev/telemetry/prometheus | prometheusRegistry, metricsHandler, fetchMetricsHandler, for server processes. Browser metrics go through otelExporter() and an OpenTelemetry collector. |
@docx-editor.dev/telemetry/server | roomTelemetry, hmacRoomLabel |
@docx-editor.dev/telemetry/hocuspocus | withCollaborationTelemetry, serveMetrics, requireBearerToken, hmacRoomLabel |
For the full guide, see Telemetry.
License
EigenPal Pro License. See LICENSE.md.