react-pie-donut-chart
Description
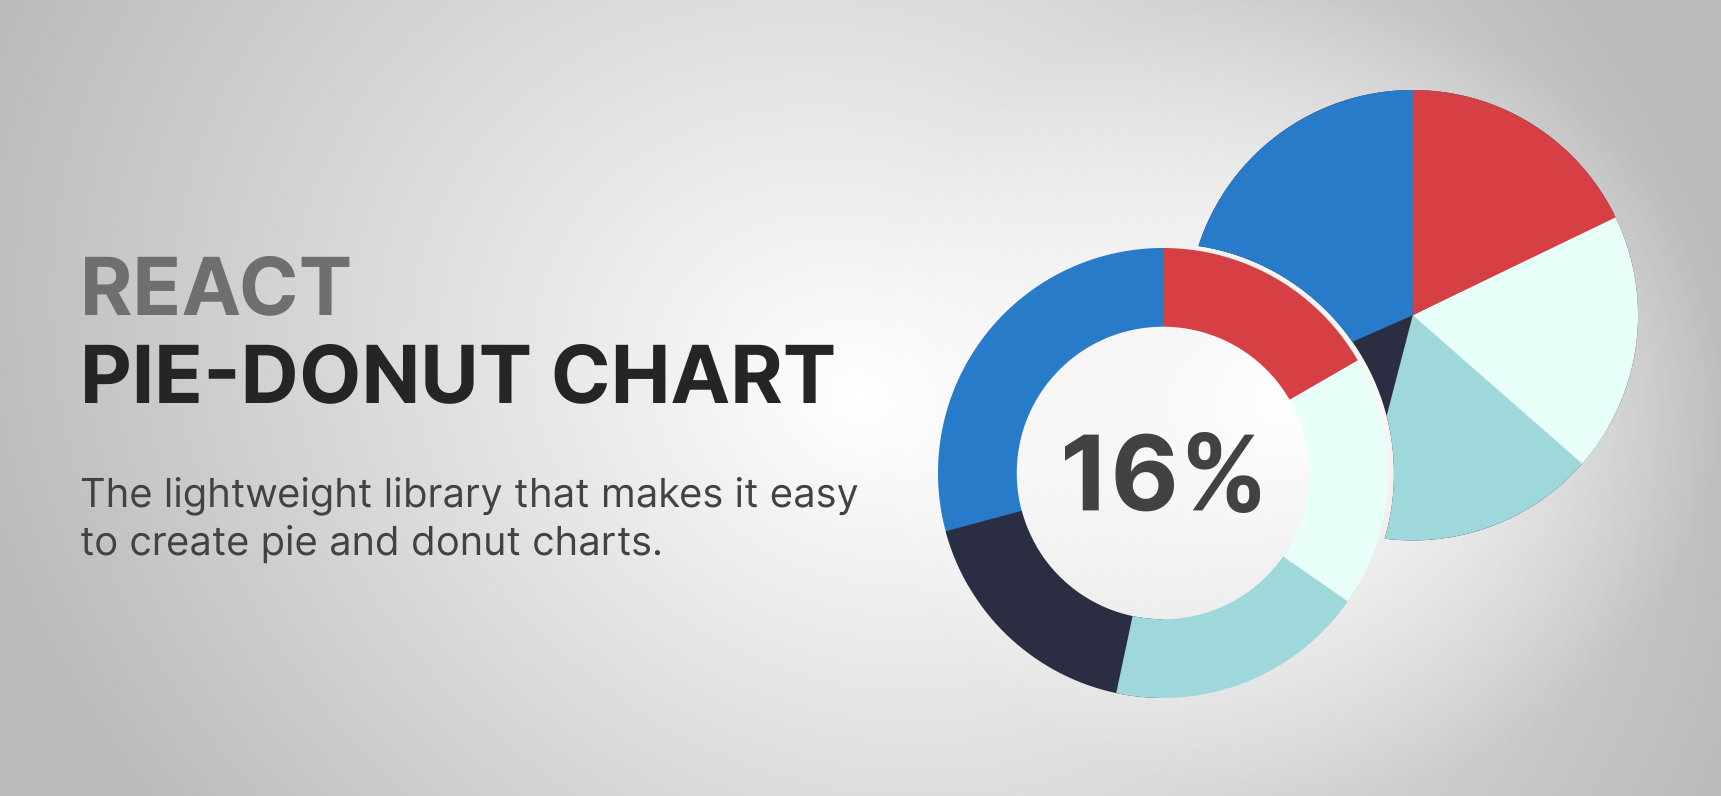
This lightweight library allows you to create "pie" and "donut" charts easily
The chart component has very flexible settings. It can accept a passed size or automatically adjust to the size of the parent component. Moreover, this component is accessible.
Features
- ✔️lightweight
- ✔️flexible settings
- ✔️both "Donut" & "Pie" variants
- ✔️accessible
- ✔️responsive (svg re-renders when it's needed)
- ✔️ability to show some text in the center of the chart
- ✔️ready for TypeScript
- ✔️detailed documentation
- ✔️100% Tests-covered
🎬 Demo video
⚠️ If the video is not loading, try going to the GitHub repo or using the direct link
🌐 Demo page coming soon
🔧 Installation
npm install @garvae/react-pie-donut-chart
or
yarn add @garvae/react-pie-donut-chart
⚙️Properties
❕ Required props
Data prop
Chart data. An array of objects (
Array<TDataItem>) with properties described below:
| Name | Type | Default | Required | Description |
|---|---|---|---|---|
| color | string | undefined | - | The color of the chart segment. Must be CSS type 'color'. Default generated automatically |
| order | number | undefined | - | Order of segments in a chart. Default generated automatically |
| segmentId | string | undefined | - | The unique ID of the chart segment. Default generated automatically |
| value | number | undefined | + | Segment value |
parentRef prop - Required if the size prop is not passed
| Name | Type | Default | Description |
|---|---|---|---|
| parentRef | RefObject | undefined | Ref to the parent HTMLElement |
size prop - Required if the parentRef prop is not passed
| Name | Type | Default | Description |
|---|---|---|---|
| size | number | undefined | Chart size |
❔ Optional props
| Name | Type | Default | Description |
|---|---|---|---|
| animationSpeed | number | 200 | The speed (in milliseconds) of the animation when the values of the chart element change |
| chartCenterSize | number | undefined | The name of the chart center class. The "chart center" is the svg element above the main chart. It's kind of like a text background. "Chart center" will not be shown without "chartCenterSize" parameter. Don't use it if you just want to create a donut-type chart, it's better to pass the parameter "donutThickness" instead |
| children | `ReactNode | string | number` |
| className | string | undefined | Main |
| classNames | string | undefined | Chart elements classNames |
| colors | string | undefined | Chart elements colors |
| resizeReRenderDebounceTime | number | 50 | Prevents unnecessary re-renders. Debounce is disabled when 'resizeReRenderDebounceTime' = 0 or when the value of the "size" property is set |
| donutThickness | number | undefined | The thickness of the donut segments. You should pass this prop if you want to create a donut chart. |
| fontSize | number | undefined | The font size. By default, it calculates automatically to fit the size of the whole chart (outer radius) if the chart is "Pie" type. If the chart is "Donut" type this param calculates automatically to fit the size of "donut hole" (inner radius). |
| gap | number | undefined | Gap between segments |
| hoverScaleRatio | number | 1.05 | The ratio of the "scale" of the segment when it's hovered, selected or focused |
| isScaleOnHover | boolean | TRUE | Enables or disables "scale" of the segment when it's hovered, active or focused |
| isSelectOnClick | boolean | TRUE | Enables or disables segment selection on click on it |
| isSelectOnKeyEnterDown | boolean | TRUE | Enables or disables segment selection on "enter" key press on it |
| isSelectedValueShownInCenter | boolean | TRUE | Enables or disables the display of the value of the selected segment in the center of the chart |
| maxSize | number | undefined | Chart maximum size. |
| minSize | number | undefined | Chart minimum size |
| stylesHoveredSegment | CSSProperties | undefined | Your own styles for hovered, selected or focused segments |
| onSegmentClick | (segmentId: string) => void | undefined | Callback for segment "onClick" event |
| onSegmentKeyEnterDown | (segmentId: string) => void | undefined | Callback for segment "onKeydown" event. Fires only for the "enter" key |
| selected | string | undefined | Selected segment ID. In most cases you don't need it. But if you want to control this state manually - welcome =) |
| widthSegmentFocusedOutline | number | 4 | The width of the "outline" (stroke) of the focused segment. By default, it automatically resizes based on chart size and has a ratio of 0.0066. This means that this stroke width = <chart_size> * 0.0066 |
| tabIndex | number | 0 | Enables or disables chart navigation with a "tab". Default - accessible - you can navigate the chart with the keyboard ("tab" button) And in most cases there is no reason to change it. |
| text | string | undefined | Text to show in the center of the chart. By default, it shows the total value of the provided "data" or the value of the selected segment or the value of the focused segment |
📌 Notes
You can choose whether you want to resize the chart based on the "parent" size or if you want to set the size manually. If you need a resizable chart, you must be sure that the parent container does not have zero width and height. If you want to set the size manually just add the
sizeproperty
The
Charthas a lot of flexible settings. You can check them out above.
Read more about
classNames&colorsprops below
📌 Additional info about classNames & colors props
classNames prop - Chart elements classNames. An object with following props:
| Name | Type | Default | Description |
|---|---|---|---|
| chartBackground | string | undefined | Chart background className. Background - svg element the same size as the chart, and it is rendered if 'colorSegmentsBackground' property is provided |
| chartCenter | string | undefined | Center circle (donut hole) className |
| chartSegment | string | undefined | Chart segment className |
| chartSegmentsBackground | string | undefined | Chart segment background className |
| children | string | undefined | Chart children className |
| svgGroupSegments | string | undefined | Chart segments group element className |
| svgGroupSegmentsBackground | string | undefined | Chart segments group element className. This background is another element under the chart segments group element |
| svgGroupText | string | undefined | Chart text group element className |
| svgObjectText | string | undefined | Chart text element className. is something like element-wrapper for the text container |
| text | string | undefined | Text container className |
colors prop - Chart elements colors. An object with following props:
| Name | Type | Default | Description |
|---|---|---|---|
| chartBackground | string | undefined | Color of the chart background. Background is svg element same size with chart. Not renders if this param was not passed |
| chartCenter | string | #ffffff | Center circle (donut hole) color |
| segmentFocusedOutline | string | #287bc8 | Focused segments outline (stroke) color |
| segmentsBackground | string | undefined | Background color of the chart segments background element. Segments background is an svg element same size with chart. 1. Not renders if this param was not passed 2. This is not the segments background. This is background of element under all segments. Sounds complicated, I know... But it needed if you want to create a chart with gaps between segments and to color this space (gap) between segments. When the chart is Pie type this param works same like 'colorChartBackground' prop, but if chart is Donut type then current param will color only the circle under the segments but not the whole chart |
| text | string | undefined | The color of the text. By default, it will be same color with selected segment (if any segment is selected) or same color with the biggest value in the "data" array. |
Make sure the colors provided to the "PieDonutChart" meet the following requirements:
Color must be onlyHEXstring and must be
- 7-characters starts with "#" symbol -
'#ffffff'- or 6-characters without "#" symbol -
'ffffff'- or 4-characters starts with "#" symbol -
'#fff'- or 3-characters without "#" symbol -
fff
🚀️ Example
import PieDonutChart, { DataItem } from '@garvae/react-pie-donut-chart';
import React from 'react';

const DATA: DataItem[] = [
    {
        color: '#287BC8',
        id: '001',
        order: 1,
        value: 10,
    },
    {
        color: '#D64045',
        id: '002',
        order: 2,
        value: 40,
    },
    {
        color: '#daf6ec',
        id: '003',
        order: 3,
        value: 30,
    },
    {
        color: '#9ED8DB',
        id: '004',
        order: 4,
        value: 20,
    },
    {
        color: '#2B2D42',
        id: '005',
        order: 5,
        value: 50,
    },
];

// "Pie" type chart variant with "parentRef" prop (auto-resize)
const ChartPieAutoResize = () => {
    const ref = React.useRef<HTMLDivElement>(null);

    return (
        <div
            ref={ref}
            style={{ height: '300px', width: '300px' }}
        >
            <PieDonutChart
                data={DATA}
                parentRef={ref}
            />
        </div>
    );
};

// "Pie" type chart variant with "size" prop (no auto-resize)
const ChartPieWithFixedSize = () => {
    return (
        <PieDonutChart
            data={DATA}
            size={300}
        />
    );
};

// "Donut" type chart variant with "size" prop (no auto-resize)
const ChartDonutWithFixedSize = () => {
    return (
        <PieDonutChart
            data={DATA}
            gap={10}
            size={300}
        />
    );
};
🙋♂ Author - Garvae
❤ Show your support
Give a ⭐ if this project helped you!
🤝 Contributing
Contributions, issues and feature requests are welcome!
Feel free to check issues page. You can also take a look at the contributing guide.